Figure 1.
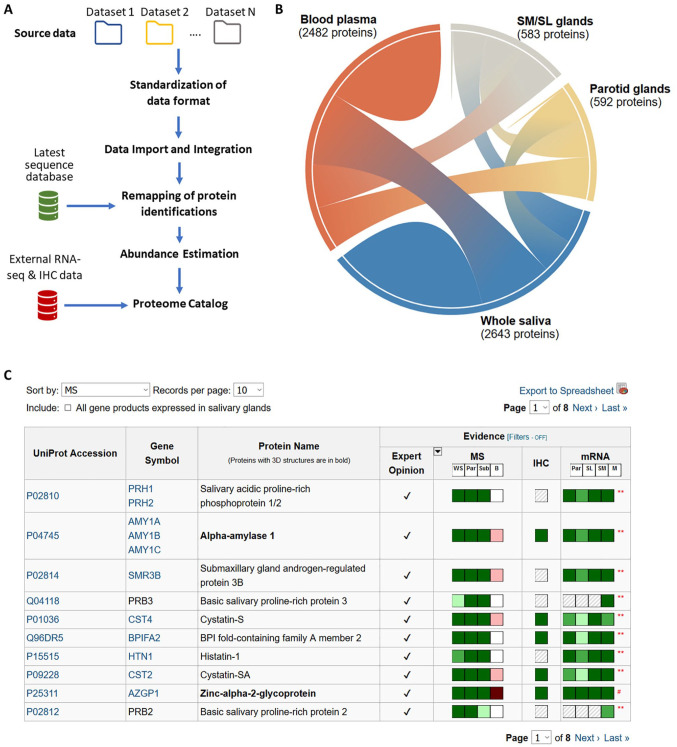
Development of the human salivary proteome catalog. (A) Overview of the workflow developed to standardize and integrate data sets submitted in variable data formats and contents and to update identification results using the most up-to-date protein sequences. (B) Chord diagram to visualize the contribution of ductal secretions of the major salivary glands and blood plasma to the complex mixture of proteins in whole saliva. (C) Protein catalog table, which uses color indicators to depict different types of experimental and editorial evidence available in support of including corresponding proteins in the catalog. The color indicators include 3 levels of shades from dark to light, indicating the levels of protein abundance as estimated by mass spectrometry (MS) spectral counts, by immunohistochemistry (IHC), or by mRNA abundance (green color indicators). Striped patterns indicate that information is not available. White indicates an absence of protein or mRNA. For the display in this figure, the filter function has been applied to show only proteins that are upregulated in saliva based on glandular mRNA expression. B, blood plasma (red color indicators); M, minor salivary glands; MS, protein abundances in secretions; mRNA, RNA levels in tissues; Par, parotid gland; Sub, submandibular/sublingual glands; WS, whole saliva.

