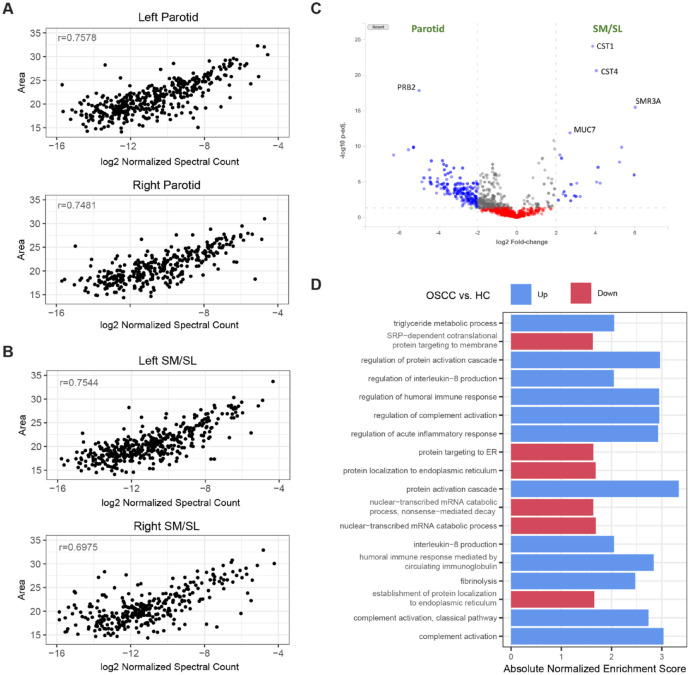
Figure 4.
Differential analyses comparing glandular ductal secretions and saliva samples from a biomarker discovery study demonstrate the capabilities of the Human Salivary Proteome (HSP) Wiki. (A, B) The correlation of protein abundance levels estimated by the peak area (Top3 approach) and spectral counting methods in parotid and submandibular/sublingual (SM/SL) glandular ductal saliva, respectively. Pearson’s correlation coefficients for representative samples are shown. (C) Volcano plot showing differential protein abundances between the parotid and SM/SL glands. The plot was generated using the DE analysis tool from the Wiki. Proteins with statistically significant fold changes ≥log2 are shown as blue dots. Gene symbols for the most gland specifically expressed proteins are shown. (D) Enriched Gene Ontology (GO) biological processes from gene set enrichment analysis (GSEA) of the differential abundance results between salivary proteomes of oral squamous cell carcinoma (OSCC) subjects and healthy controls. Only pathways with adjusted P values ≤0.05 and ≥66% leading gene representation (i.e., enrichment signals coming from at least 66% of proteins in the pathway) are shown.

