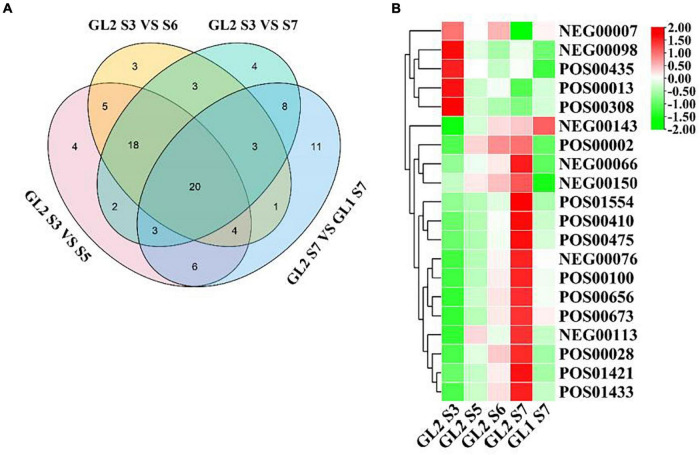
FIGURE 4.
Venn diagram analysis of metabolites related to the formation of early mature trait (A) and heat map of expression levels of metabolites (B). In (A) the number represents the number of metabolites contained in each area. In (B) the bar on the right represents the normalized coefficient range of the expression level. The redder the bar, the higher the expression level, and the greener bar, the lower the expression level.

