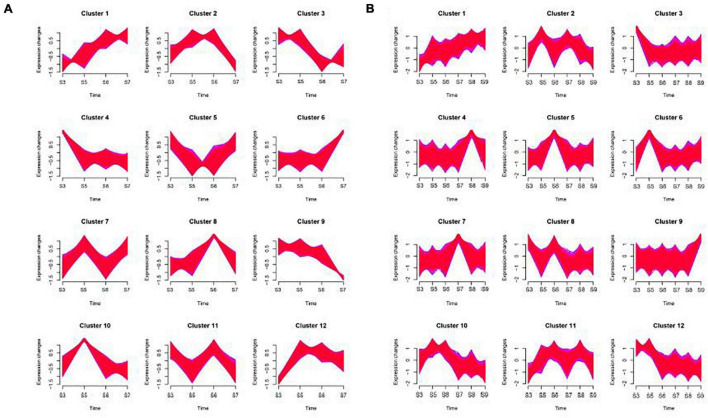
FIGURE 5.
Time series analysis of genes on ‘Ganlv 2’ (A) and ‘Ganlv 1’ (B). According to the trend of gene expression, genes with consistent expression patterns will be clustered into the same cluster. The red area was composed of multiple lines of gene expression line chart. The edges of the red area were framed with blue lines.

