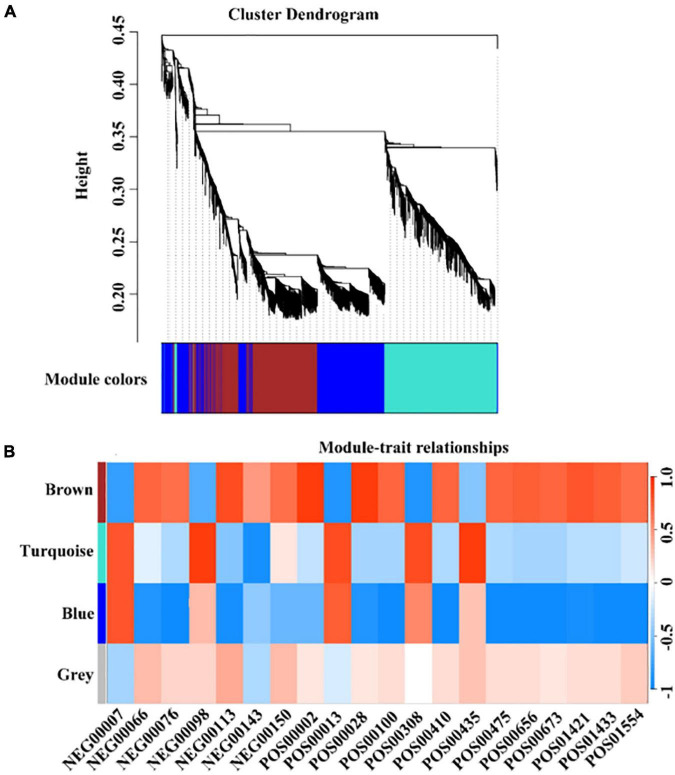
FIGURE 7.
WGCNA analysis of early maturation-related genes and metabolites. (A) The colors of each block indicate the correlation coefficient between the modules and the traits. (B) The bar on the right represents the range of correlation coefficients between modulus and traits. The redder means the more positive correlation, and the bluer means the more negative correlation.

