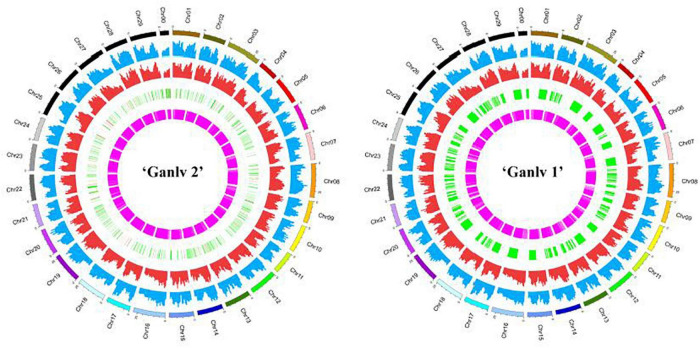
FIGURE 9.
Circos of ‘Ganlv 2’ and ‘Ganlv 1’. The outermost circle represents the chromosome and its position. From the outside to the inside are single nucleotide polymorphism (SNP) frequency, Indel frequency, position and length of copy number variation (CNV), and position and length of structural variation (SV). In the circle where CNV is located, the red region represents chromosome copy number amplification, and the green region represents chromosome copy number deletion.

