
FIGURE 4.
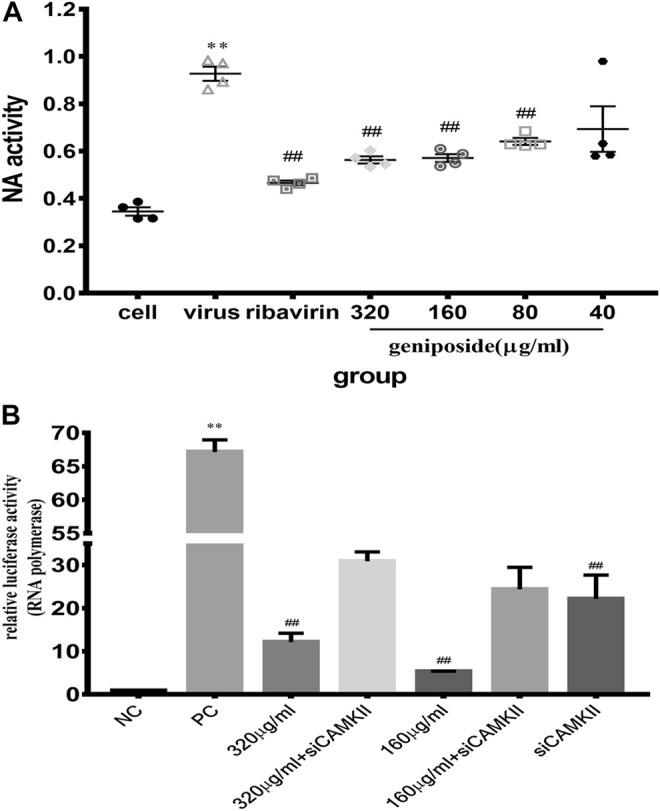
(A) Effect of geniposide on neuraminidase activity levels in MDCK cells infected with IAV. Values are expressed as the mean ± SEM (n = 4), **p < 0.01 compared to the normal control group, and ## p < 0.01 compared to the virus control group. (B) Relative luciferase activity of IAV polymerase in HEK-293T cells. Relative luciferase activity was detected using a dual-luciferase reporter assay system. Values are expressed as the mean ± SEM (n = 4), **p < 0.01 compared to the negative control group (NC), and ## p < 0.01 compared to the positive control group (PC).