Figure 8.
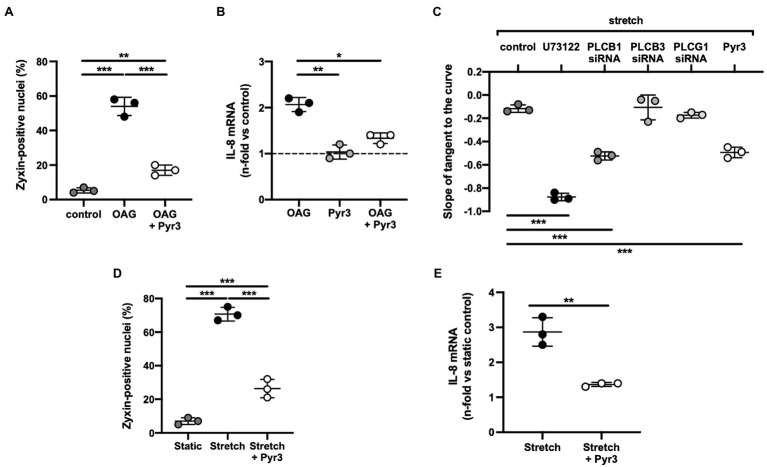
(A) 1-Oleoyl-2-acetyl-sn-glycerol (OAG)-induced activation of zyxin in human umbilical vein endothelial cells (HUVEC). Summary of the quantitative (immunofluorescence) analysis of zyxin-positive nuclei in control cells (passage 1) and after treatment with the diacylglycerol analogue OAG (100μm) alone for 24h or following a 6h pre-incubation with the TRPC3-selective inhibitor Pyr3 [ethyl-1-(4-(2,3,3-trichloroacrylamide)phenyl)-5-(trifluoromethyl)-1H-pyrazole-4-carboxylate; 10μm]. A primary rabbit polyclonal anti-zyxin antibody (Suresh et al., 2012) was used at a dilution of 1:250. Images were obtained using an Olympus IX81 confocal microscope equipped with an IXDSU disk unit and analyzed by using the cell^R software package. Two-way ANOVA with Sidak post-test for multiple comparisons, **p<0.01, ***p<0.001 as indicated, n=3 for each group. (B) Analysis of IL-8 gene expression by real-time RT-PCR analysis (Ghosh et al., 2015) in passage 1 HUVEC following the same treatment, *p<0.05, **p<0.01 as indicated, n=3 for each group. The dashed line represents the IL-8 mRNA level in control cells under static conditions. (C) Cyclic stretch-induced calcium transients in Fura-2-loaded HUVEC (passage 0) stretched for 50cycles using elastic membranes. Five µM each of U73122 (pan-phospholipase C inhibitor) and Pyr3 was used. In addition, cells were transfected with siRNA against phospholipase Cβ1, β3 and γ1 (resulting in a 42, 35 and 38% knockdown, respectively) followed by the same stretch protocol. Quantitative analysis of the rate of decay (phase II) of the stretch-induced calcium transient by ratiometric imaging, ***p<0.01 as indicated, n=3 for each group. (D) TRPC3 channel inhibition by Pyr3 strongly reduces stretch-induced zyxin activation in HUVEC. Quantitative summary of the percentage of zyxin-positive nuclei in control HUVEC (passage 1) under static conditions or following 6h of cyclic stretch without or with prior treatment by Pyr3 (10μM). HUVEC were seeded onto collagen I-coated BioFlex elastomers (Flexercell) and stretched or not with a sinusoidal profile at 0.5Hz and 10% cyclic elongation. ***p<0.01 as indicated, n=3 for each group. (E) Analysis of IL-8 mRNA abundance in HUVEC (performed as described under B) following the same treatment. Two-tailed student’s t-test, **p<0.01, n=3 for each group.

