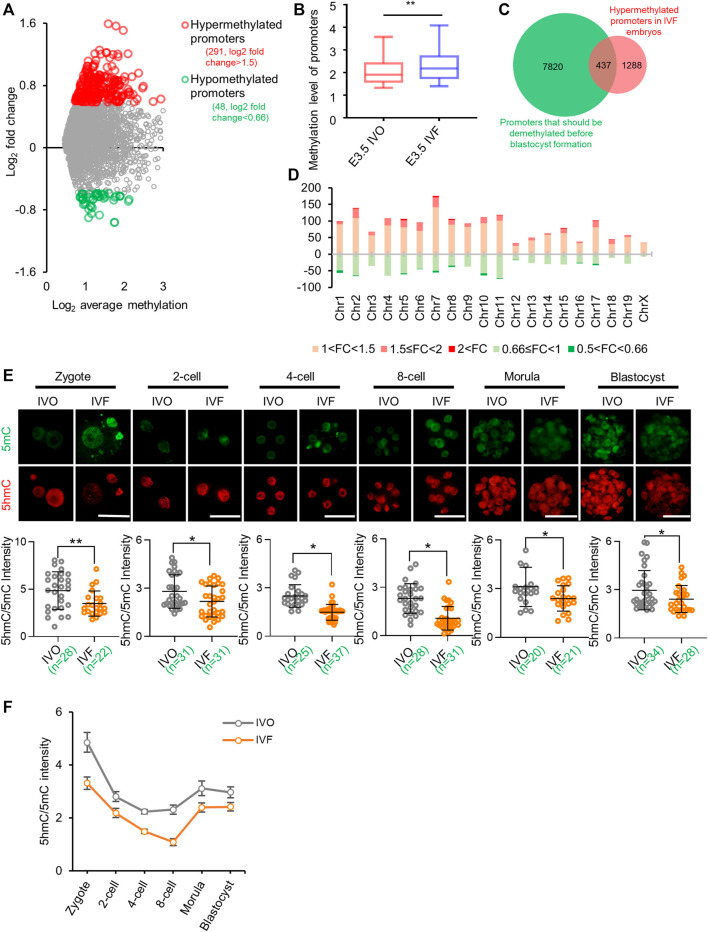
FIGURE 1.
IVF embryos undergo impaired active DNA demethylation and exhibit global hypermethylation by blastocyst stage (A) Distribution of differentially methylated promoters in IVF blastocysts compared with their IVO counterparts (B) Box plot of promoter methylation levels of IVO and IVF blastocysts (C) The Venn diagram of hypermethylated promoters in IVF blastocysts (Ren et al., 2015) and promoters that should be demethylated before blastocyst formation (Smith et al., 2012) (D) The chromosome-wide distribution of hypermethylated and hypomethylated promoters with different fold changes in IVF blastocysts (E) Immunofluorescent images of 5mC (green) and 5hmC (red) staining in IVO and IVF embryos from zygote to blastocyst stages. Lower panels: quantification of 5hmC/5mC ratio in IVO and IVF embryos. Circles represent the relative ratio in each embryo. The number of embryos in each group is indicated (F) Dynamics of TET-mediated active demethylation in IVO and IVF preimplantation embryos, revealed by 5hmC/5mC ratio at each stage. Data show the means ± SD of three independent experiments. *p < 0.05, **p < 0.01. Scale bar, 50 μm.

