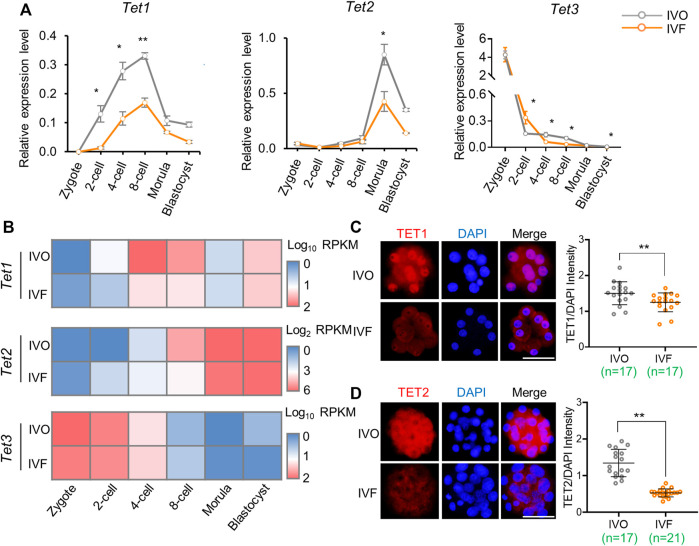
FIGURE 2.
Expression levels of Tet family members is inhibited in IVF preimplantation embryos (A) Relative expression levels of Tet1, Tet2, and Tet3 in IVO and IVF embryos detected by qRT-PCR during preimplantation development (B) Heat map illustrating expression patterns of Tet1, Tet2, and Tet3 in IVO and IVF embryos detected by RNA-seq during preimplantation development (C–D) Immunofluorescent images of TET1 (C) and TET2 (D) in IVO and IVF 8-cell embryos and morulae, respectively. Right panels in C and D: quantification of the relative protein levels of TET1 and TET2. Each circle represents the level of immunofluorescent signal of TET1 or TET2 relative to the DAPI. The number of embryos in each group is indicated. Data show the means ± SEM (A) and means ± SD (C–D) of three independent experiments. At least 50 embryos were pooled at each time point for each replicate of qRT-PCR detection. *p < 0.05, **p < 0.01. Scale bar, 50 μm.

