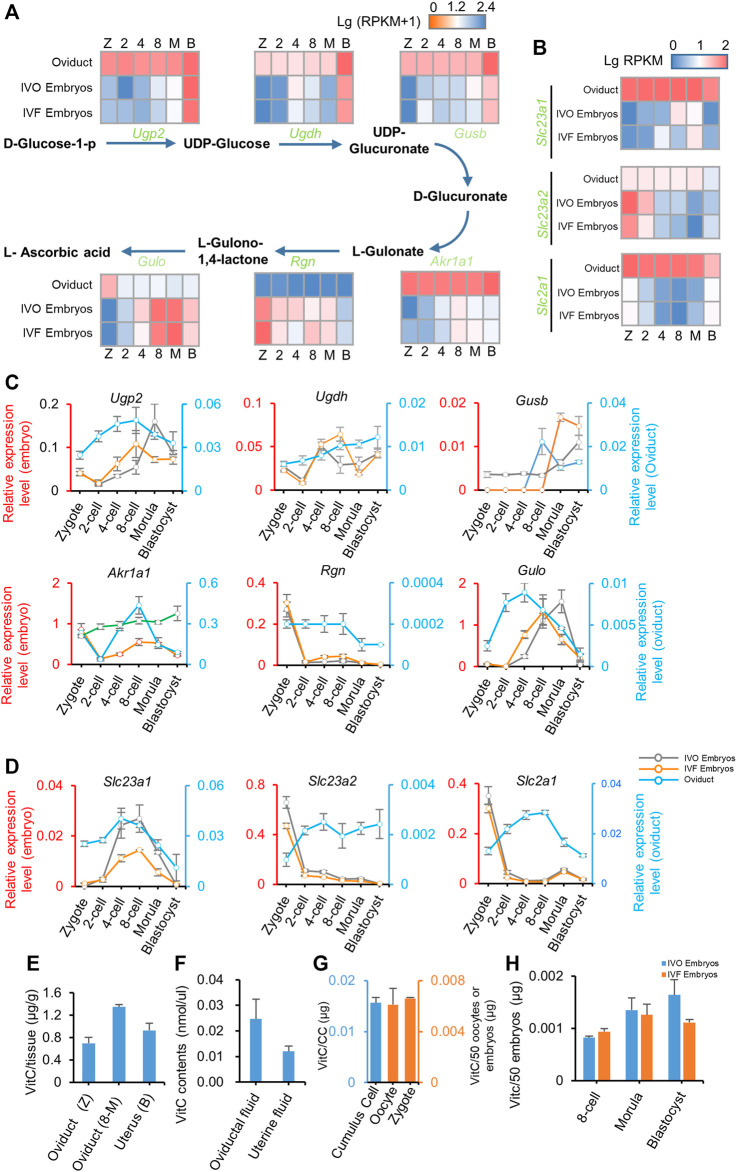
FIGURE 3.
Vitamin C is enriched in oviductal environment (A, B) Heat map illustrating the expression patterns of genes underlying vitamin C biosynthesis (A) and transfer (B) pathway in IVO and IVF embryos, as well as in temporally corresponding oviduct detected by RNA-seq during preimplantation development (C, D) Relative expression levels of genes underlying vitamin C biosynthesis (C) and transfer (D) pathway in IVO and IVF embryos (left axis), as well as in temporally corresponding oviduct (right axis) detected by qRT-PCR during preimplantation development (E-H) Detection of vitamin C contents in oviduct/uterus (E) and oviductal/uterine fluid (F), oocytes, zygotes and surrounding cumulus cells (G), as well as IVO and IVF preimplantation embryos (H) at different stages. CC indicates the total cumulus cells surrounding 50 oocytes. Data shows the means ± SEMs of three independent experiments. At least 50 embryos were pooled in each group for each replicate of qRT-PCR detection.

