
Figure 2.
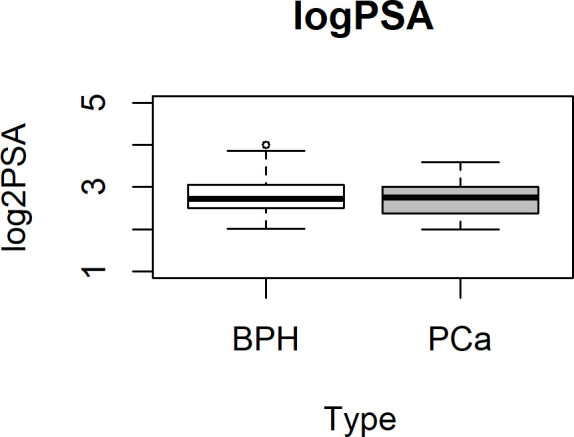
PSA boxplot in BPH and PCa groups. Box plot showing the stratification of samples into the BPH (white box) or PCa (gray box) group. Data are shown as log2 PSA levels (ng/ml). BPH, benign prostatic hyperplasia; PCa, prostate cancer.
Official websites use .gov
A
.gov website belongs to an official
government organization in the United States.
Secure .gov websites use HTTPS
A lock (
) or https:// means you've safely
connected to the .gov website. Share sensitive
information only on official, secure websites.
PSA boxplot in BPH and PCa groups. Box plot showing the stratification of samples into the BPH (white box) or PCa (gray box) group. Data are shown as log2 PSA levels (ng/ml). BPH, benign prostatic hyperplasia; PCa, prostate cancer.