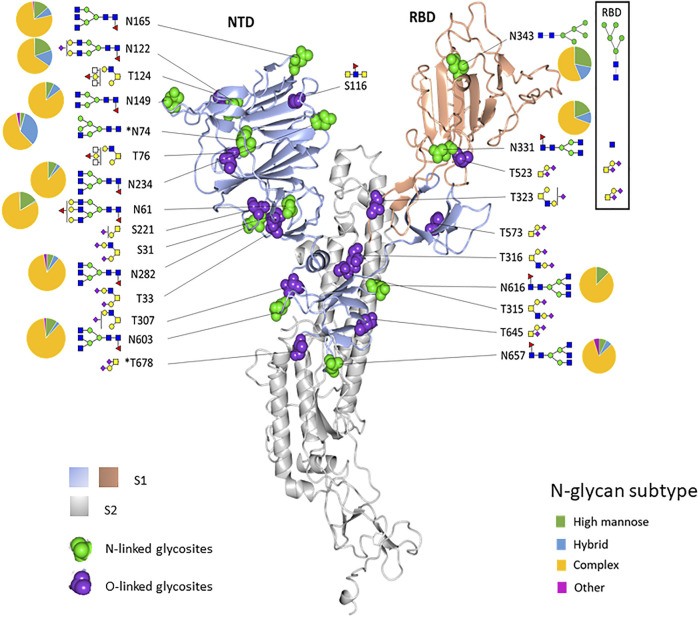
FIGURE 4.
Structure-based mapping of glycans on the recombinant SARS-CoV-2 spike protein. The modeling of experimentally observed glycosylation site compositions is illustrated on the monomeric SARS-CoV-2 spike glycoprotein (PDB code 6ZGG). The S1 subunit is colored light blue and peach. The S2 subunit is gray. N- and O-linked glycosylation sites are indicated by green balls and purple balls, respectively. Most abundant glycans at each site are shown. Pie charts show the percentage of glycan subtypes at each site. The boxed area shows the predominant glycans and the N-linked glycosylation subtype distribution for the glycans identified in the recombinant RBD sample. *N74 and T678 are not in the structure.

