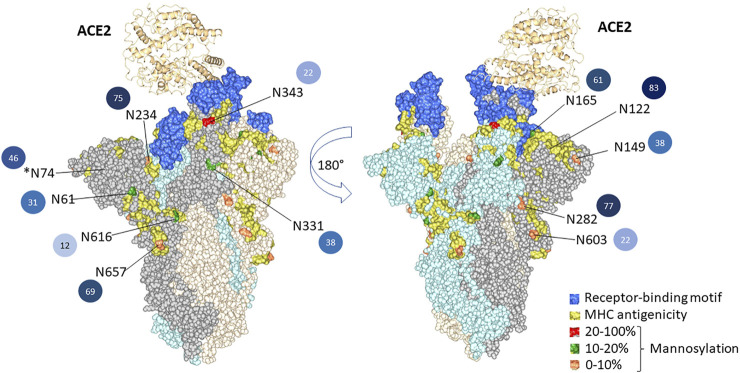
FIGURE 5.
3D structural modeling of spike glycosylation microheterogeneity. The N-glycosites are mapped on the SARS-CoV-2 trimer structure (PDB code 7A96). Blue indicates the receptor-binding motif in the RBD region. Yellow indicates the predicted MHC antigenic sites. The glycosites are colored according to the mannosylation percentage. The number of glycoforms at each site from less to more heterogeneous glycoforms detected is colored by light to dark, and the number is also listed.

