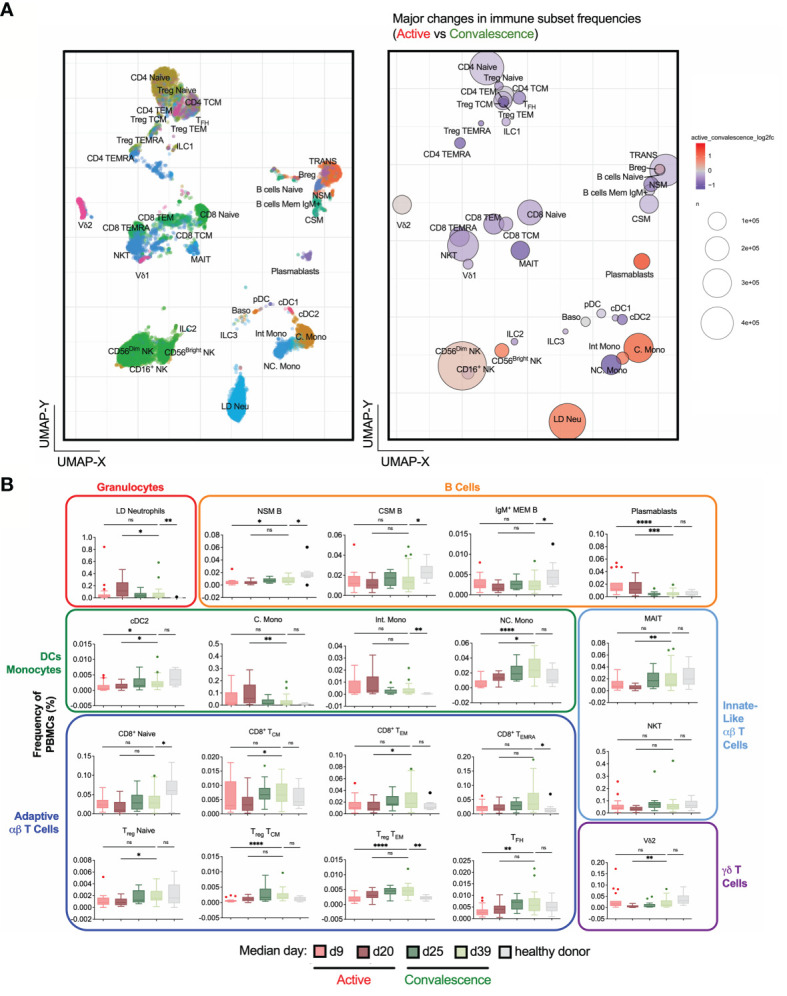
Figure 2.

Frequency changes in 38 basic immune cell populations with SARS-CoV-2 infection. (A) Uniform Manifold Approximation and Projection (UMAP) plots of 38 main immune cell populations detected by mass cytometry (left). Right: Bubble representation of fold changes in the detected populations during activeinfection relative to convalescence, with color-coding done on a log2 scale, and bubble size reflecting the percentage of the subset. (B) Frequency-time plots of immune cell populations of interest over the course of disease. Asterisks indicate statistical significance- ns, not significant, *p < 0.03; **p < 0.002; ***p < 0.0002, ****p < 0.0001 (Kruskal-Wallis test with multiple comparison corrected on each disease phases versus healthy controls).
