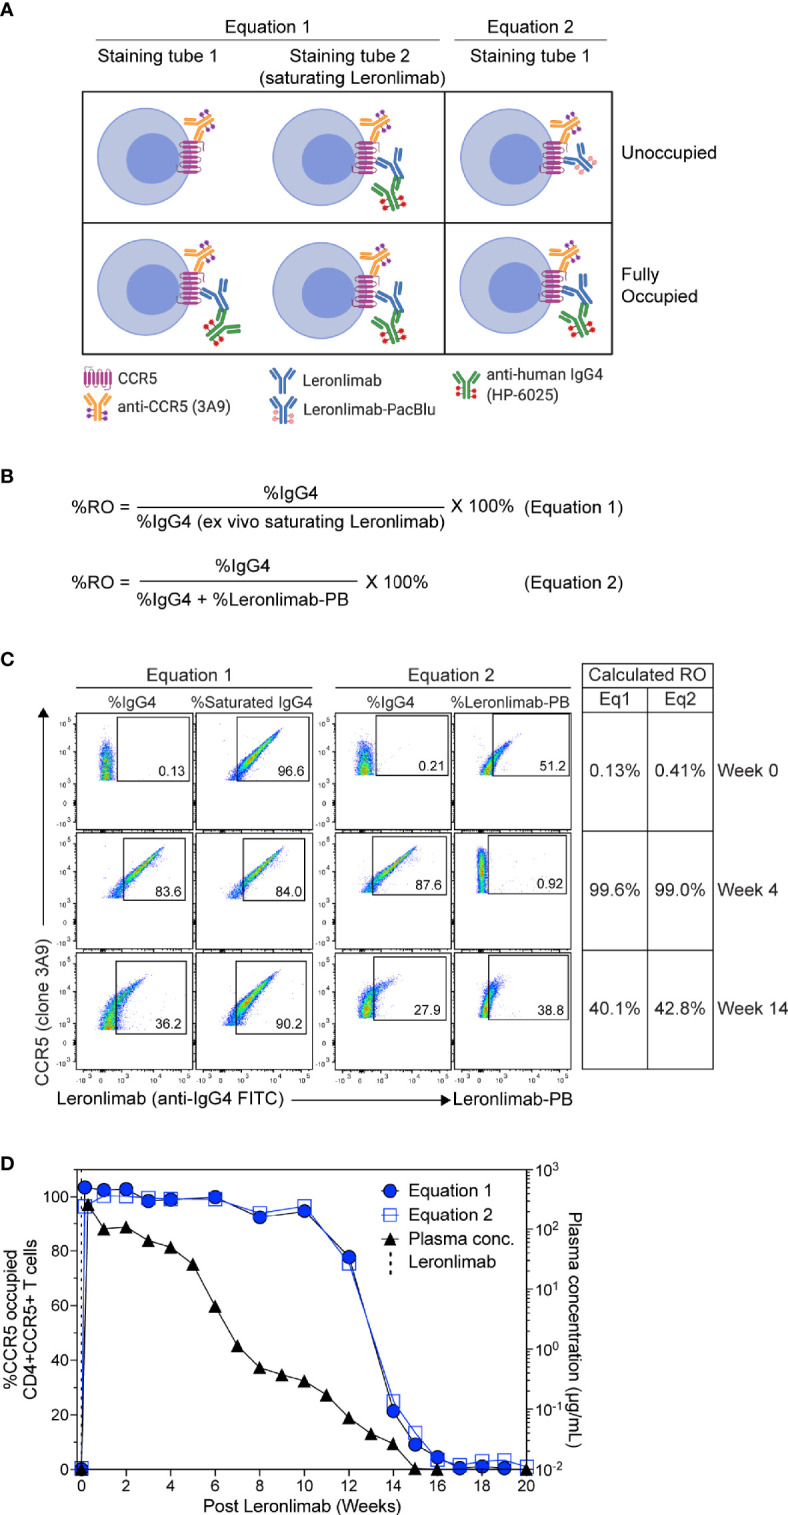
Figure 2.

CCR5 receptor occupancy assay overview. (A) Flow cytometry diagram showing the interactions between anti-CCR5, Leronlimab, Leronlimab-PacBlu (PB), and anti-human IgG4 for the two equations using a CCR5 unoccupied (top) and fully occupied (bottom) scenario. (B) Equations for calculating CCR5 RO. (C) Representative flow cytometry plots displaying the different components needed to calculate for the two equations using a rhesus macaque that received a single 50 mg/kg SC Leronlimab injection. Equation 1 used %IgG4+ events within CD45+, singlet, live, CD3+, CD4+/CD8-, and CCR5+ events. Equation 2 used %IgG4+ and Leronlimab-PB+ events within CD45+, singlet, live, CD3+, CD4+/CD8-, and CCR5+ events. Table on the right shows the calculated CCR5 RO calculated by the two equations at study weeks 0, 4, and 14 post single Leronlimab injection. (D) Left Y-axis is for CCR5 RO by Leronlimab on peripheral blood CD4+CCR5+ T cells calculated by equation 1 (solid blue circle) and equation 2 (open blue square). Right Y-axis is for the longitudinal plasma concentration (solid black triangle) in blood samples from the treated macaque.
