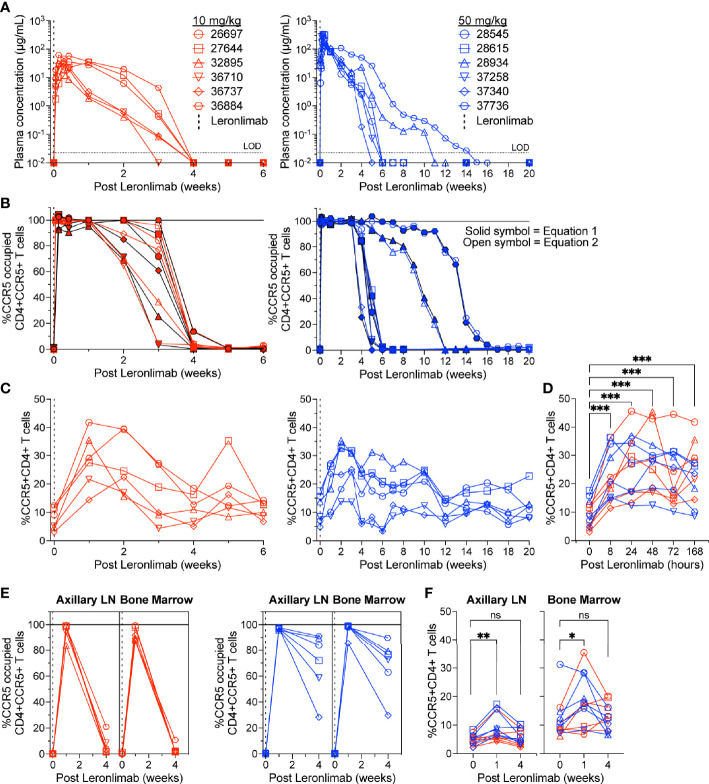
Figure 3.
CCR5+CD4+ T cell frequencies increase with CCR5 RO. Leronlimab-naïve, SIV-naïve, rhesus macaques received a single 10 mg/kg (n=6; red; left) or 50 mg/kg (n=6; blue; right) SC Leronlimab. (A) Longitudinal Leronlimab concentration in plasma. (B) Longitudinal CCR5 RO by Leronlimab on peripheral blood CD4+CCR5+ T cells. (C, D) Peripheral blood CCR5+CD4+ T cell frequency for (C) longitudinal weekly timepoints, separated by treatment group and (D) hourly timepoints for both treatment groups within the first week post Leronlimab. (E, F) Axillary lymph node and bone marrow (E) CCR5 RO by Leronlimab and (F) %CCR5 on tissue-resident CD4+ T cells. (B, E) Solid symbol represents CCR5 RO calculated from equation 1 while open symbol represents CCR5 RO calculated from equation 2. P-values in panels (D, F) generated by Wilcoxon signed-ranked test; ns, not significant, *p < 0.05; **p < 0.01; ***p = 0.0005.

