. 2021 Nov 18;57(96):12980–12983. doi: 10.1039/d1cc04612h

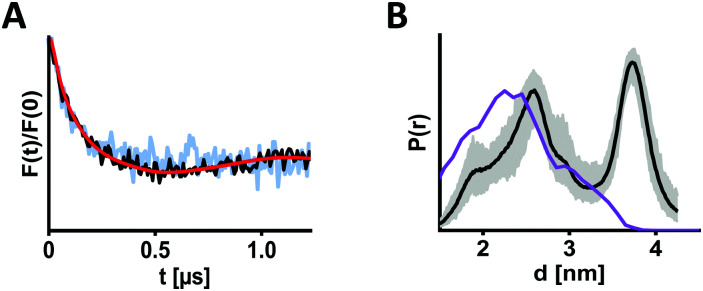
Fig. 4. DEER distance measurements of BtuB using Diels–Alder click chemistry. (A) BtuB_F404 → SCO was spin labelled with PaNDA in situ (black) or in isolated outer membranes (light blue; for full length trace see Fig. S11, ESI), and DEER was measured after irradiation in presence of TEMPO-CNCbl. For comparison, form factors after background subtraction were scaled with respect to the modulation depth (Δin situ = 9.5% and ΔOM = 3.0%). (B) Corresponding in situ distance distribution (black) with validation (grey area). The purple line indicates the simulated distance distribution (using MtsslWizard), assuming a 1 : 1 ratio of the two possible linker regioisomers.

Fig. 4