
FIGURE 4.
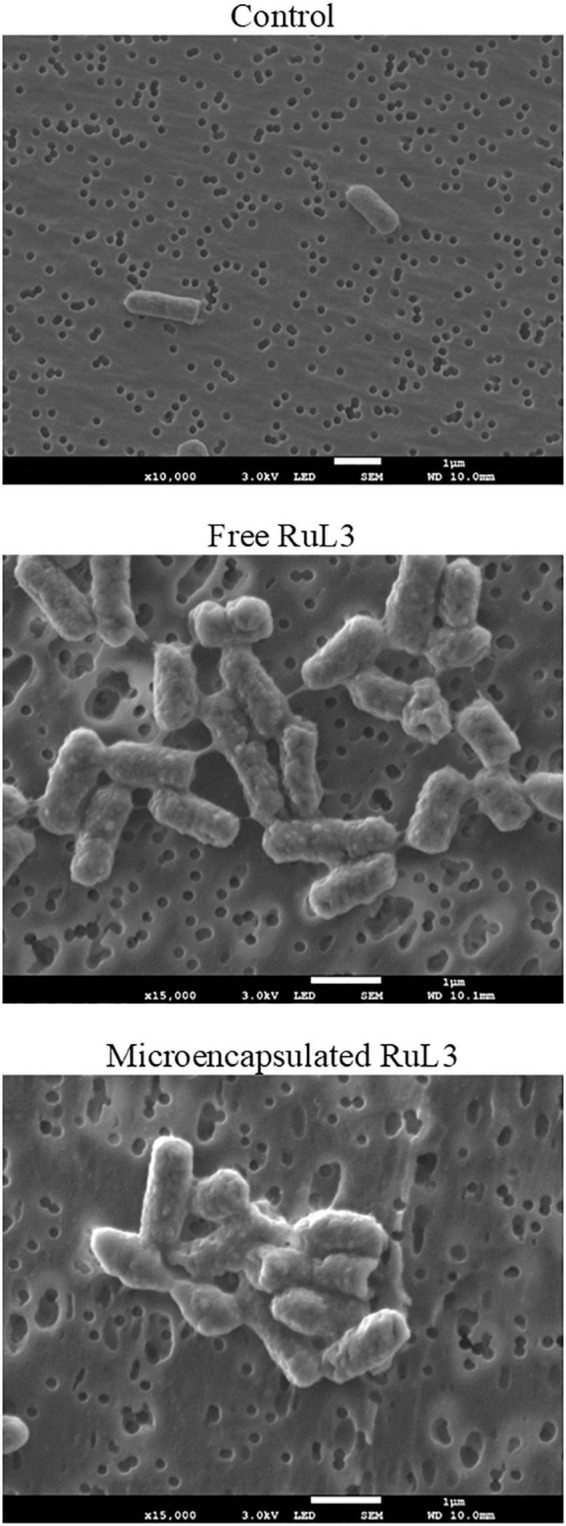
Scanning electron micrographs of Escherichia coli biofilm cells, after treatment with free and micoencapsulated RuL3 at the MIC. The control represents cells treated with potassium phosphate buffer.
Official websites use .gov
A
.gov website belongs to an official
government organization in the United States.
Secure .gov websites use HTTPS
A lock (
) or https:// means you've safely
connected to the .gov website. Share sensitive
information only on official, secure websites.
Scanning electron micrographs of Escherichia coli biofilm cells, after treatment with free and micoencapsulated RuL3 at the MIC. The control represents cells treated with potassium phosphate buffer.