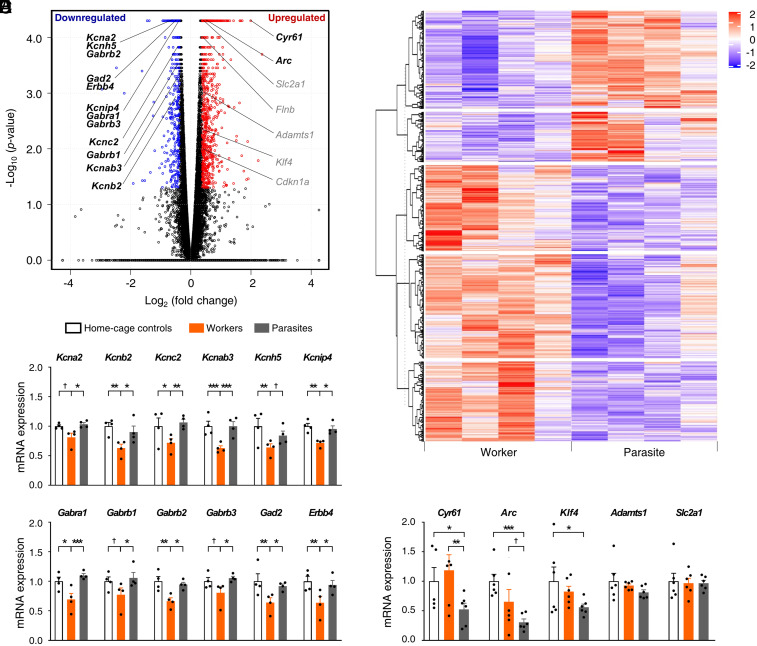
Fig. 7.
Differential worker–parasite gene expressions. (A) Volcano plot highlighting DEGs (n = 4 groups). (B) Heatmap illustration of DEGs with a red-to-purple gradient depicting up-regulation (red) and down-regulation (purple). (C–E) Validation of RNA-sequencing results by qRT-PCR (mean ± SEM; n = 4 groups in C and D; n = 6 groups in E). (C) mRNA expression levels of some K+ channel subunits were reduced in workers’ compared to parasites’ ACC. (D) Specific GABAA receptor subunit and GABA signaling–related gene expressions decreased in workers’ ACC. (E) In contrast, a subset of activity-responsive genes was higher in workers’ than parasites’ ACC. †P < 0.1, *P < 0.05, **P < 0.01, and ***P < 0.001 (Fisher's PLSD test following two-way mixed ANOVA) (88, 90). Refer also to Dataset S1 and SI Appendix, Table S1 and Figs. S8–S10.

