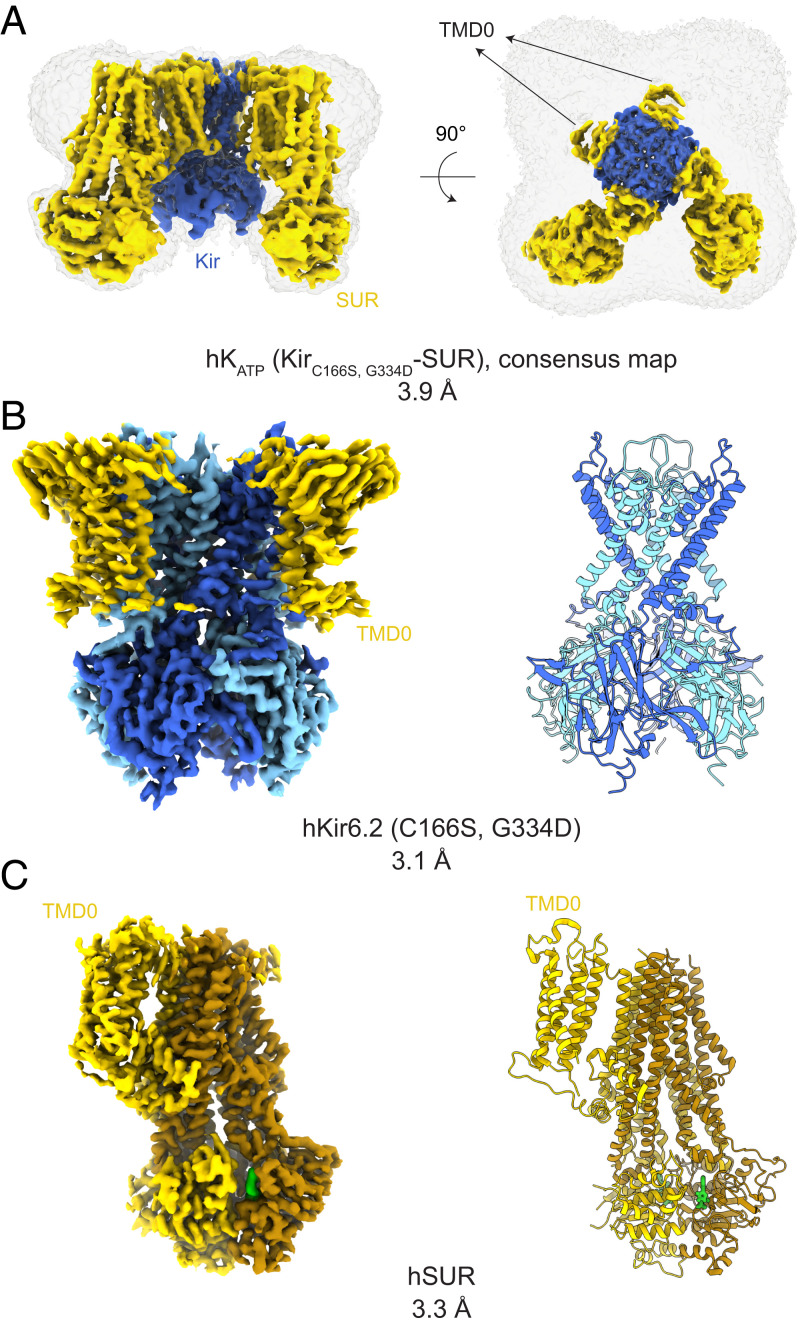
Fig. 2.
Cryo-EM map and structural models for hKATP (Kir6.2C166S, G334D-SUR1). (A) A 3.9-Å consensus cryo-EM map of KATP before symmetry expansion shows hKir6.2 (C166S, G334D) (blue) and hSUR1 (yellow). A map at low contour level covering the complete molecule is shown in gray. TMD0s from all four SURs show clear density. (B) A 3.1-Å cryo-EM map and corresponding structural model of hKir6.2 (C166S, G334D) obtained by focused refinement. Four channel subunits are colored in different shades of blue. TMD0 from SUR are colored in yellow. (C) A 3.3-Å cryo-EM map and corresponding structural model of hSUR1 obtained by focused refinement. TMD0, TMD1, and NBD1 are colored in yellow, while TMD2 and NBD2 are colored in dark brown. Mg2+-ATP and Mg2+-ADP are colored in green.

