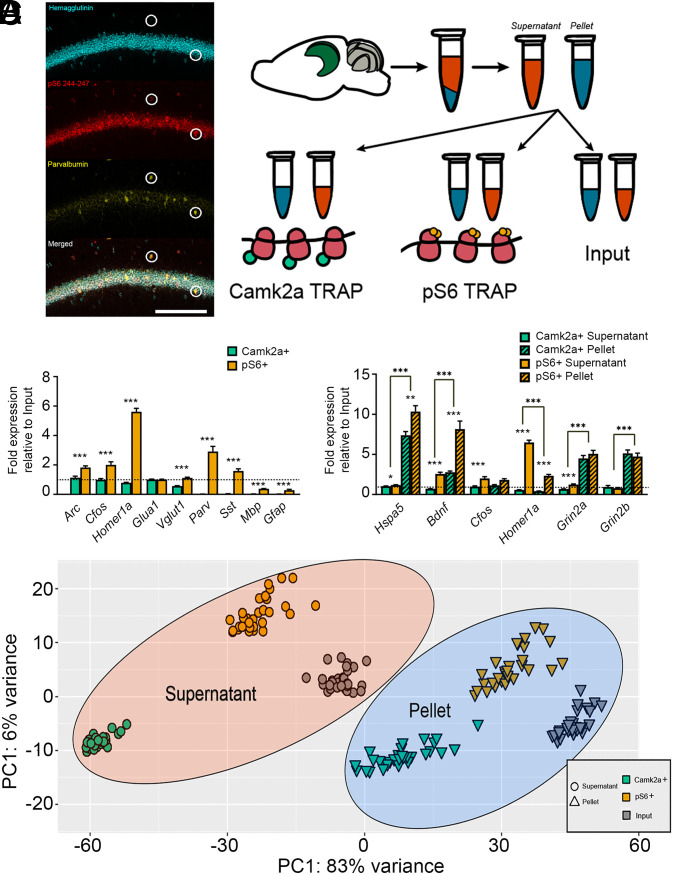
Fig. 1.
TRAP-based profiling of hippocampal cell populations and isolation of subcellular fractions. (A, Left) Confocal images showing expression of HA (Camk2a), phosphorylated S6 (pS6), and parvalbumin in area CA1 of dorsal hippocampus. Highlighted neurons are parvalbumin, pS6, and HA. (Scale bar, 100 μm.) (Right) Schematic of protocol for isolating mRNAs from subcellular fractions and different cell populations using TRAP. (B) Camk2a+ (cyan) and pS6+ (orange) TRAP mRNA enrichment values were calculated (versus Input) for activity-dependent (Arc, Cfos, Homer1a), excitatory neuron (Glua1, Vglut1), inhibitory neuron (Parv, Sst), and glial (Mbp, Gfap) transcripts. *** indicates P < 0.001 for enrichment value differences between Camk2a+ and pS6+ neuronal populations (t test, n = 7/group). (C) Camk2a+ and pS6+ TRAP enrichment in supernatant (solid bars) and pellet (hatched bars) fractions (versus Input) for transcripts encoding secreted (Bdnf), transmembrane (Grin2a, Grin2b), ER (Hspa5), and cytosolic (Cfos, Homer1a) proteins. (t test, n = 9/group, *, **, and *** indicate P < 0.05, P < 0.01, and P < 0.001, respectively). (D) PCA plot (variance stabilizing transformation [VST], Deseq2) for RNA-seq data from the three cell populations (Input, Camk2a+ neurons, and pS6+ neurons) and two fractions (supernatant and pellet). Data are shown for n = 30 biological replicates (i.e., bilateral hippocampi) from 30 total mice across the four treatment groups.

