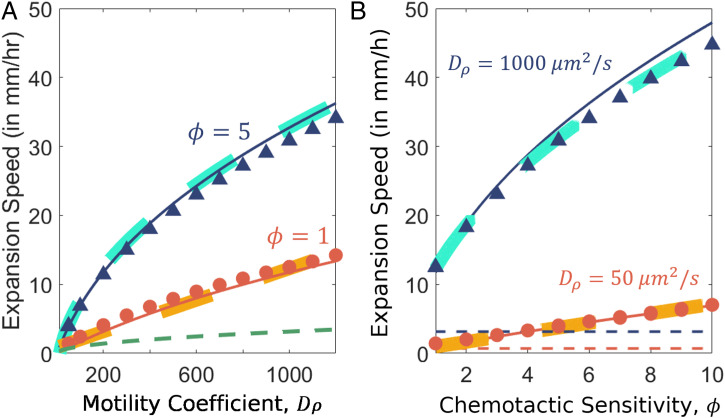
Fig. 3.
Dependence of expansion speed on motility parameters. (A) Dependence on cellular motility . Numerical solutions for and are shown by red circles and dark blue triangles, respectively. Analytical solutions following Eq. 23 are shown by corresponding solid red and blue lines. The green dashed line represents the stable Fisher speed, , the minimum expansion speed of our system. (B) Dependence on the chemotactic sensitivity, . Numerical solutions for and are shown by red and dark blue circles, respectively. Analytic solutions following Eq. 23 are shown by the corresponding solid lines. Thick yellow and cyan dashed lines are best fits for the respective values of and to demonstrate that for and that if is large compared to Da. Unless specified, all parameter values are the default values given in SI Appendix, Table S1.

