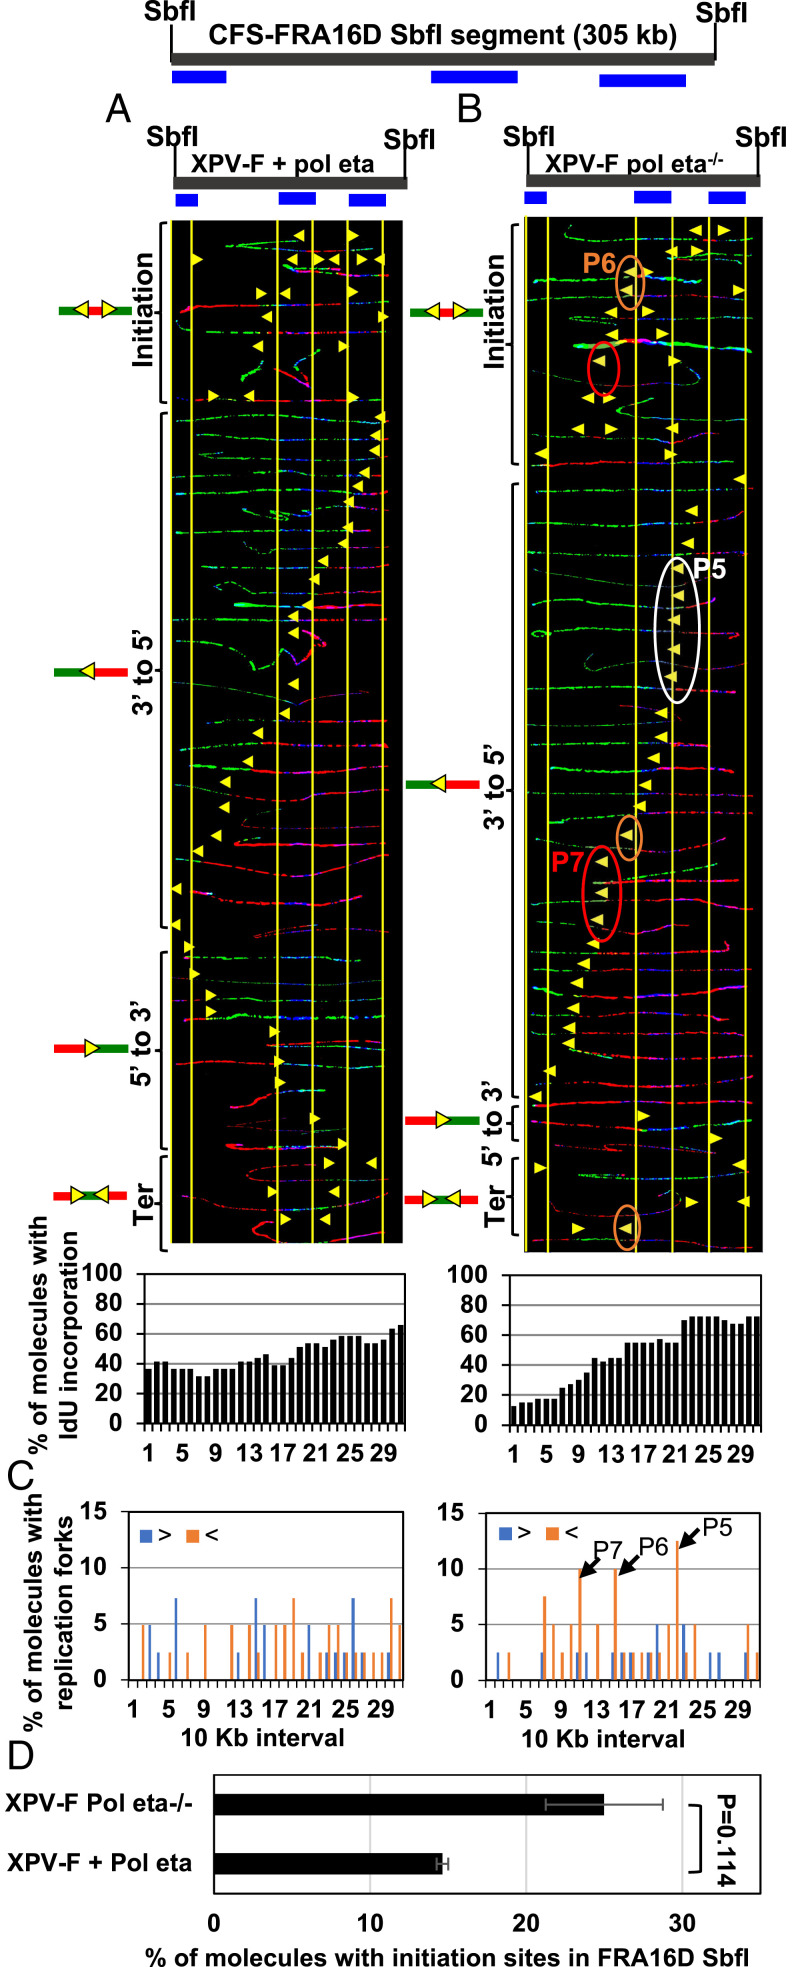
Fig. 2.
Replication is perturbed at the CFS-FRA16D in Pol eta-deficient fibroblasts. (A and B, Top) Locus map of the CFS-FRA16D SbfI segment with the location of the FISH probes. (A and B, Middle) Photomicrographs of labeled DNA molecules from XPV Pol eta−/− fibroblasts stably complemented with Pol eta (A) or not (B). Molecules are arranged as in Fig. 1. The yellow arrowheads encircled by white (P5), brown (P6), and red (P7) ovals indicate three different sites where replication forks paused. For each cell line, DNA molecules were photographed and collected from two sets of slides, where the molecules were independently stretched and independently stained with IdU and CldU antibodies (and the probe). Molecules that represented pausing at P5–P7 were independently identified in both sets of slides, showing that pausing molecules do not result from experimental variation due to a stretching or a staining artifact on a particular slide. (A and B, Bottom) The percentage of molecules with IdU incorporation at each 10-kb interval calculated from molecules above (A and B, Middle) are shown in histograms. (C) The percentage of molecules with replication forks at each 10-kb interval in the FRA16D SbfI segment, quantified from molecules in A and B. Replication forks progressing from 3′ to 5′ and 5′ to 3′ are denoted by orange < and blue >, respectively. The black arrows indicate the pause sites (P5–P7) and correspond to the ovals in B. (D) The percentage of molecules with initiation sites in FRA16D SbfI segments calculated from molecules in A and B. Error bars represent mean ± SEM from two independent experiments.

