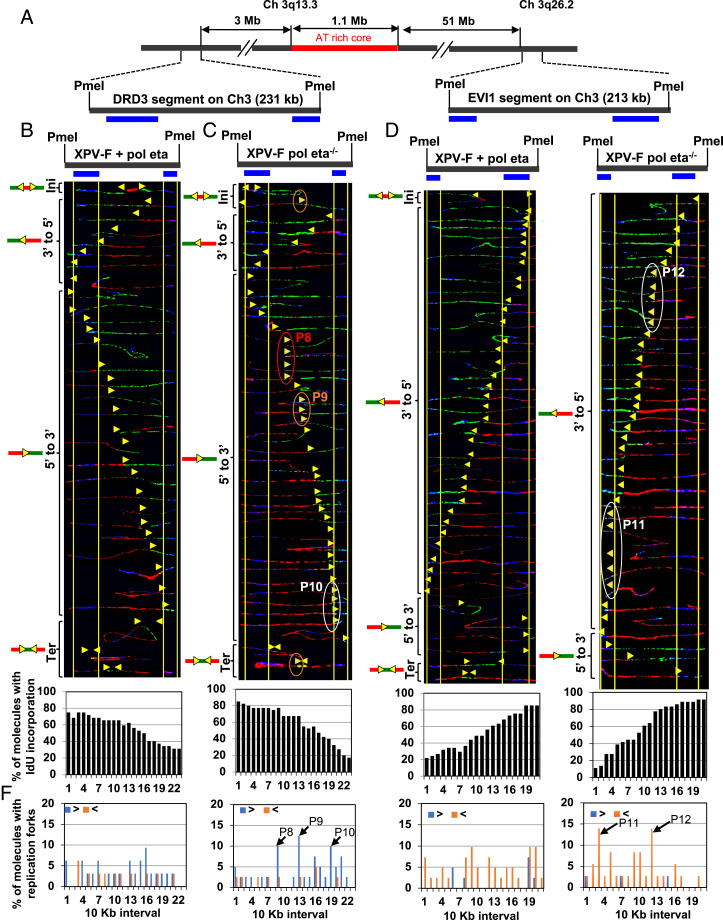
Fig. 3.
Replication is perturbed at the CFS on chromosome 3q13.3 in Pol eta-deficient fibroblasts. (A) Locus map of DRD3 and EVI1 segments with respect to the AT-rich core of the CFS at chromosome 3q13.3. (B and C, Top) Locus map of the DRD3 segment with the location of the FISH probes. (B and C, Middle) Photomicrographs of labeled DNA molecules from XPV Pol eta−/− fibroblasts stably complemented with Pol eta (B) or not (C). Molecules are arranged as in Fig. 1. The yellow arrowheads encircled by red (P8), brown (P9), and white (P10) ovals indicate three different sites where replication forks paused. As in Fig. 2, molecules that represented pausing at P9–P10 were independently identified in two sets of slides. (B and C, Bottom) The percentage of molecules with IdU incorporation at each 10-kb interval quantified from molecules above (B and C, Middle). (D and E, Top) Locus map of the EVI1 segment with the location of the FISH probes. (D and E, Middle) Photomicrographs of labeled DNA molecules from XPV Pol eta−/− fibroblasts stably complemented with Pol eta (D) or not (E). Molecules are arranged as in Fig. 1. The white ovals (P11 and P12) indicate replication-fork pausing. As in Fig. 2, molecules that represented pausing at P11–P12 were independently identified in two sets of slides, showing that the detection of pausing does not result from experimental variation. (D and E, Bottom) The percentage of molecules with IdU incorporation at each 10-kb interval quantified from molecules above (D and E, Middle). (F) The percentage of molecules with replication forks at each 10-kb interval in the DRD3 and EVI1 segments, quantified from molecules in B–E. Replication forks progressing from 3′ to 5′ and 5′ to 3′ are denoted by orange < and blue >, respectively. The black arrows indicate the most prominent pause peaks along these segments and correspond to the ovals in C and E.

