Fig. 3.
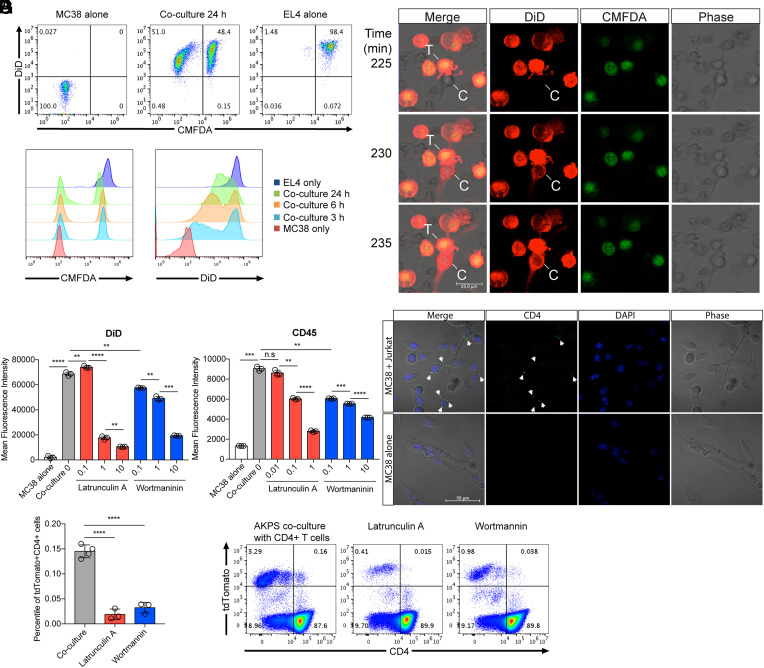
Transfer of T cell membrane proteins to colon cancer cells via trogocytosis. Mouse T cell line EL4 cells were labeled with DiD and CMFDA and membrane and cytosolic cell tracker, respectively. Labeled EL4 cells were cocultured with unlabeled mouse colon cancer cell line MC38 cells. (A) Flow cytometry analysis of the transfer of DiD and CMFDA from EL4 cells to MC38 cells in a time-dependent manner. (B) Time-lapse confocal imaging analysis of membrane protein transfer. T (T cells); EL4, C (colon cancer cells); MC38, time indicates minutes after the addition of the labeled EL4 cells to unlabeled MC38 cells plated chamber wells. EL4-MC38 cell-to-cell contact in the images was detected at about 150 min after the addition of EL4 cells in culture (Movie S1). (C and D) Statistical analyses of the intensity of DiD (C) and surface-stained CD45 (D) in MC38 colon cancer cells after 24 h coculture in the presence of Latrunculin A and Wortmannin, inhibitors of actin polymerization and PI3-Kinase, respectively (unit for inhibitors: uM). (E) Confocal microscopy analysis of CD4 protein transfer from Jurkat T cells to MC38 colon cancer cells. Jurkat cells were stained with Alexa 488–conjugated anti-human CD4 monoclonal antibody and then cocultured with MC38 for 1 h. Jurkat cells were washed out after coculture, and transferred CD4 proteins were monitored. Arrows indicate transferred CD4 proteins. (F and G) Percentiles of cancer and T cell markers tdTomato and CD4 double–positive cells in the AKPS organoid coculture system in the presence of Latrunculin A (1 μM) and Wortmannin (10 μM). Coculture was performed as described in Fig. 2 after the pretreatment of organoids with inhibitors. (C, D, and F) Representative flow cytometry data are displayed in G. n.s, not significant, **P < 0.01, ***P < 0.001, ****P < 0.0001; two-tailed t test. Error bars indicate mean ± SD. Results are representative of at least two independent experiments.

