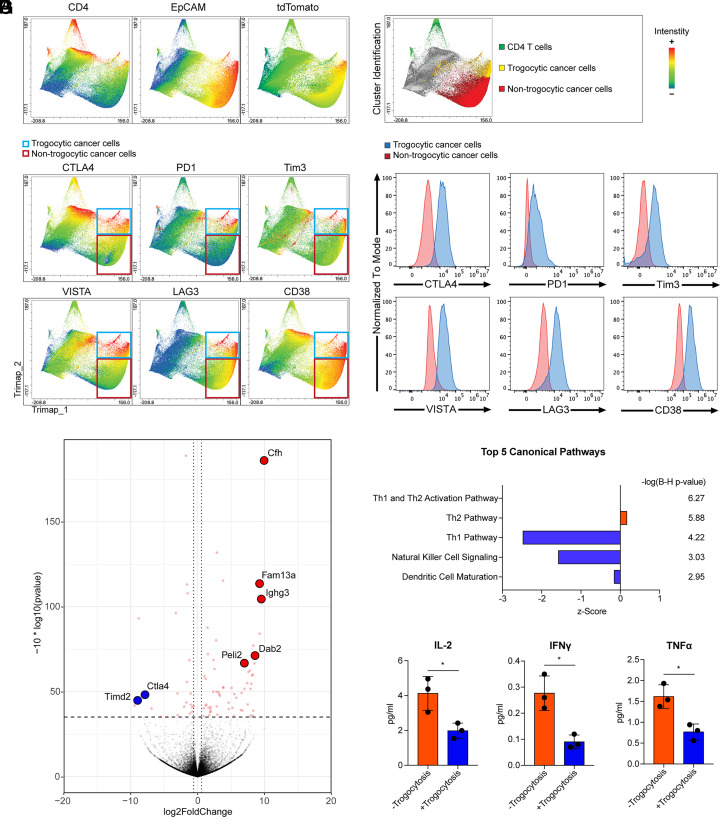
Fig. 4.
Trogocytic cancer cells acquired immune regulatory molecules in the tumor microenvironment. Trimap plot analysis of cell type marker proteins (CD4, EpCAM, and tdTomato) and immune regulatory molecules in liver metastasized colon cancer tissues are shown. Metastatic cancer cells were generated using AKPS organoids as described in Fig. 1. (A) CD4 T cells and cancer cells were identified by T cell marker CD4, epithelial cell marker EpCAM, and tumor cell reporter tdTomato. (B) The Trimap algorithm clustered tumor tissue cells based on the expression patterns of analyzed proteins. CD4+ T cells, trogocytic cancer cells (CD4+EpCAM+tdTomato+), and nontrogocytic cancer cells (CD4-EpCAM+tdTomato+) were identified and highlighted as green, yellow, and red, respectively. (C) Intensities of immune regulatory molecules are displayed in the Trimap plot. Trogocytic and nontrogocytic cancer cells were indicated by blue and red rectangules, respectively. (D) Histogram analysis of the levels of immune regulatory molecules in trogocytic cancer cells compared to nontrogocytic cancer cells. The majority cluster of trogocytic cancer cells was compared to one of the nontrogocytic cancer cell clusters with the identical intensity of tdTomato and EpCAM. (E) Liver-metastasized colon cancer cells were generated by splenic injection of dissociated AKPS organoids as described above. Cancer cells acquired CD4 and CD45 T cell markers (+Trogocytosis) and control cancer cells (−Trogocytosis) were sorted as described in SI Appendix, Fig. S2. Sorted cells were ex vivo cocultured with C57BL/6 splenocytes for 5 d at a ratio of 1 organoid to 50 splenocytes. A volcano plot analysis of the bulk RNA-seq data using the cocultured +Trogocytosis samples compared to −Trogocytosis samples is shown. Cfh (log-fold change; 9.95, q-value; 1.83E-15), Fam13a (9.22, 9.94E-09), Ighg3 (9.43, 5.85E-08), Dab2 (8.52, 1.51E-04), Peli2 (7.07, 1.61E-04), Timd2 (−8.80, 0.0012), and Ctla4 (−7.71, 0.0057) are highlighted. (F) Ingenuity pathway analysis of the RNA-seq data. Enriched top five canonical pathways are shown. Statistics of each canonical pathway are displayed as Benjamini–Hochberg P value. (G) Quantitative analysis of cytokine expression in ex vivo–cocultured samples by enzyme-linked immunosorbent assay (Eve Technology). *P < 0.05; two-tailed t test. Error bars indicate mean ± SD. Results are representative of three independent experiments. RNA-seq data used four biological replicates.

