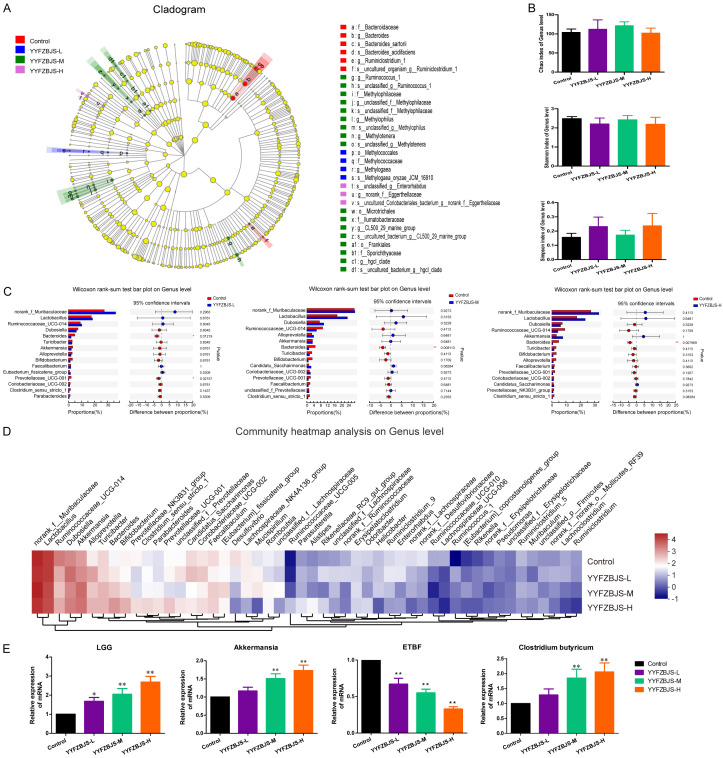
Figure 2.
YYFZBJS modulated the composition of the gut microbiota in AOM/DSS mice. A. Cladogram generated from the linear discriminant analysis effect size (LEfSe) between YYFZBJS group and Control group (n = 8 for each group). The analyses were performed at the end of the experiment. B. α Diversity of gut microbiota for mice in four different groups. C. Bar plot of compositional differences at the genus level in the gut microbiome of mice in the combination YYFZBJS group vs. the control group by the Wilcoxon rank-sum test. Data are expressed as mean ± SD. *0.01<P≤0.05, **0.001<P≤0.01, ***P≤0.001, Two-sided Hypotheses. D. Heat map of the genus with relative abundances significantly different from their relative abundances at the time of YYFZBJS administration. The differentially enriched bacterial genus in C57BL/6J mice receiving N.S and YYFZBJS. The relative abundance between control and treatment mice for the genus was calculated for each time point. E. Gut microbiota level was analyzed for mRNA expression of Lactobacillus rhamnosus (LGG), Akkermansia, ETBF, and Clostridium butyricum by quantitative RT-PCR. Data are presented as means ± SD of 8 animals per experimental group, with Welch’s correction, two-tailed t-test. *P<0.05, **P<0.01, vs. Control.

