Figure 4.
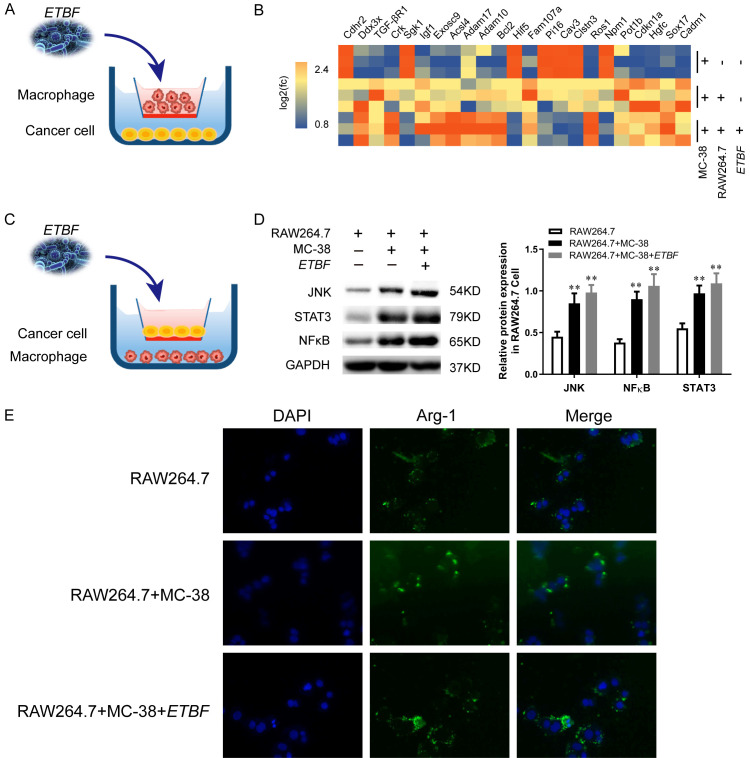
Effect of ETBF on CRC cells through TAMs in vitro. (A) After TAMs were co-cultured with MC-38 cells, ETBF was added into the mixture for 6 h. The ratio of cell to bacterial was 1:10. (B) The mRNA of MC-38 cells at the bottom of the cell plate was analyzed by RNA-seq as described in the Methods section. (C) Experimental flow chart of (A). (D) Western blot analysis of JNK, NFκ-B and STAT3 expression in RAW 264.7 cells after infection with ETBF and co-culture with MC-38 cells. Quantifications of migrated cells from three independent experiments are shown as the mean ± S.D. *P<0.05, **P<0.01, vs. RAW 264.7 cells. (E) Immunohistochemical staining with an antibody against Arg-1 in the different groups. Scale bars, 100 μM.

