
Figure 2.
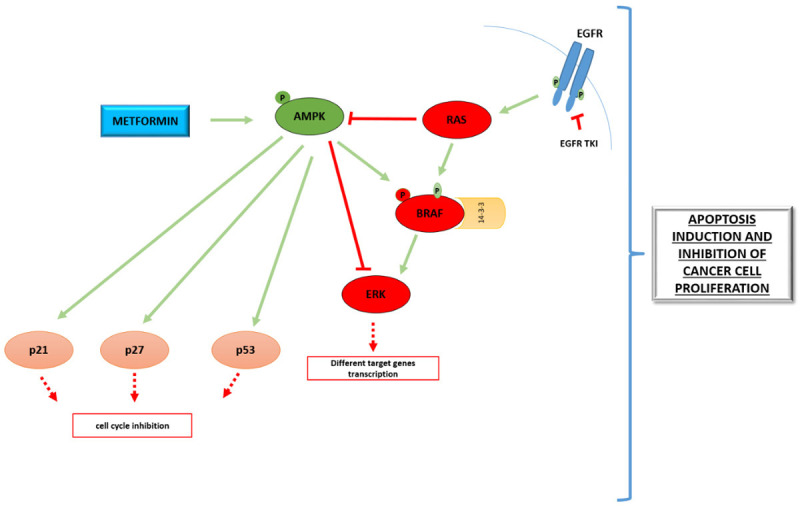
AMPK-dependent effect of metformin on evident oncogenes and tumor suppressor genes. Oncogenic MAPK pathway (red molecules) and tumor suppressors (light pink molecules) described in review are marked. Green arrows represent activation, while red lines show inhibitory interaction. Red squared boxes represent inhibition of pointed signaling regulation.