
Figure 3.
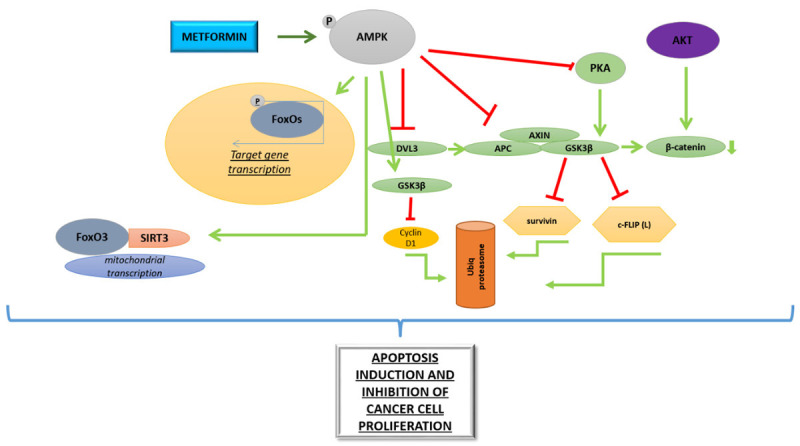
AMPK-dependent effect of metformin on atypical oncogenes and tumor suppressor genes. Green arrows represent induction, while red lines show suppression of phosphorylation or mutual molecules interaction and proper mechanisms.
Official websites use .gov
A
.gov website belongs to an official
government organization in the United States.
Secure .gov websites use HTTPS
A lock (
) or https:// means you've safely
connected to the .gov website. Share sensitive
information only on official, secure websites.
AMPK-dependent effect of metformin on atypical oncogenes and tumor suppressor genes. Green arrows represent induction, while red lines show suppression of phosphorylation or mutual molecules interaction and proper mechanisms.