Figure 1.
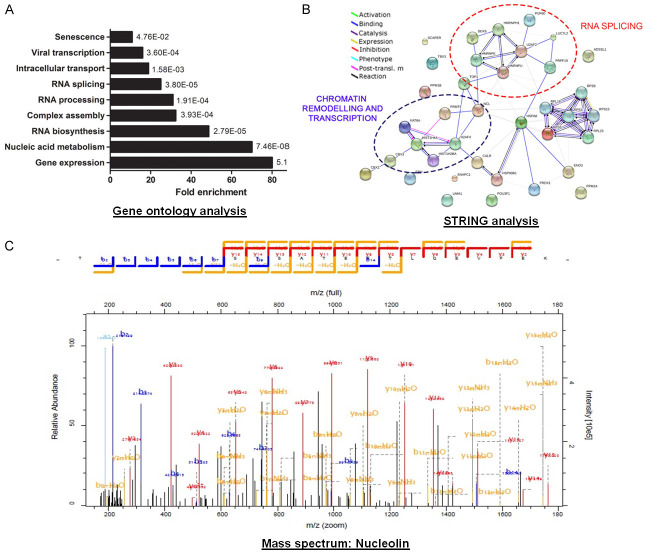
Identification of TBX3 protein partners. A. Functional classification of the TBX3 interactome. TBX3 interactors were categorised according to their biological function using GO analysis and plotted as fold enrichment compared to the total interactome. B. A network integrating physical interactions of identified TBX3 protein partners was generated using STRING. Nodes represent proteins; edges represent interactions. Clusters of interacting partners involved in RNA splicing and chromatin remodelling/transcription are circled in red and purple respectively. C. Representative fragmentation spectrum of one of the nucleolin peptides identified by mass spectrometry with the amino acid sequence TLVLSNLSYSATEETLQEVFEK.

