Figure 2.

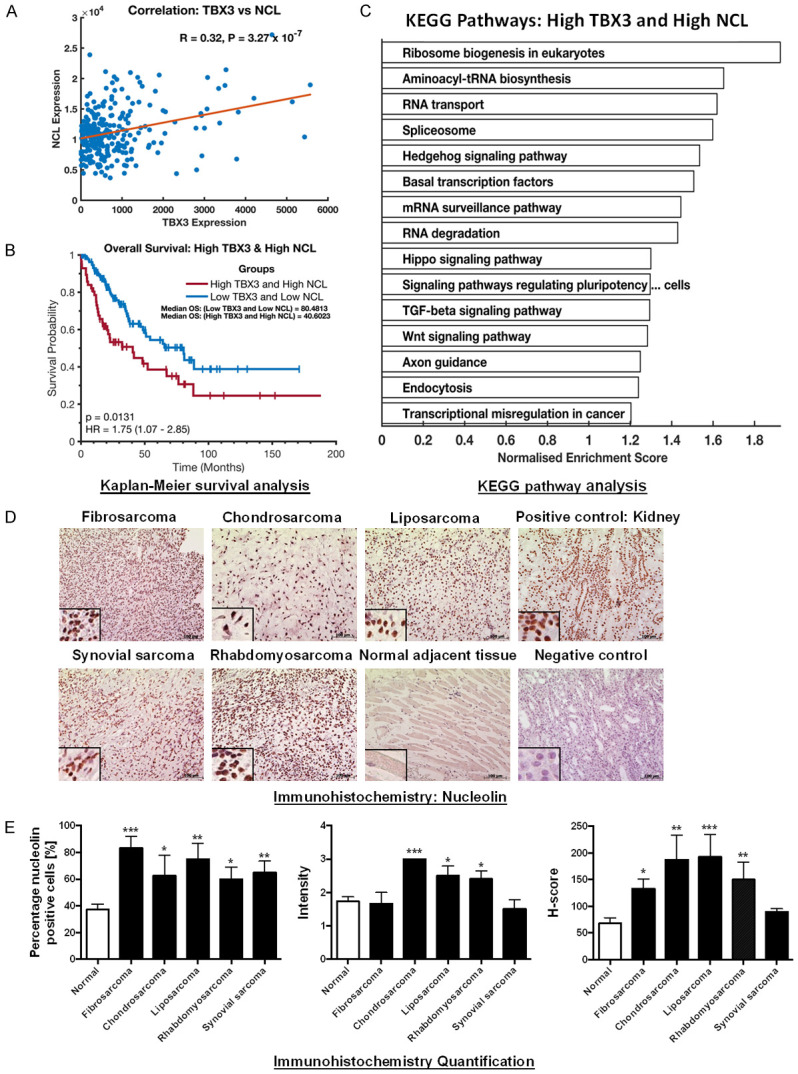
TBX3 and nucleolin (NCL) expression correlates in sarcoma patients and is associated with poor prognosis. A. Positive gene correlation between TBX3 and NCL mRNA levels across 261 TCGA sarcoma samples. Correlation coefficient R and P-values were calculated using Pearson correlation test. B. Kaplan-Meier plot displaying overall survival of TCGA sarcoma patients with high TBX3 and high NCL expression (red line) compared to low expression (blue line). P-values were calculated using the log-rank test statistic. C. Enriched KEGG pathways in TCGA sarcoma patients with high TBX3 and high NCL expression. D. Immunohistochemistry of patient-derived fibrosarcoma (N = 3), chondrosarcoma (N = 4), liposarcoma (N = 4), rhabdomyosarcoma (N = 5) and synovial sarcoma (N = 4) tissue sections and adjacent normal tissues (where present) using an antibody specific to nucleolin. Human kidney tissue was included as a positive control for nucleolin. A technical negative control was included and incubated with bovine serum albumin instead of primary antibody. Haematoxylin was used as a nuclear counterstain. Representative images are shown (scale bars, 100 μm; insets are magnified images from selected areas). E. Left panel: Column bar graph representing percentage (%) of nucleolin positive cells across tested sarcoma tissue sections. Middle panel: Scatterplot of staining intensity analysis across tested sarcoma tissue samples. Cells were quantified and graded based on staining intensity on a scale from 0 to 3 (0 = negative; 1 = mild staining; 2 = moderate staining; 3 = strong staining). Right panel: Scatterplot of H-scores across tested sarcoma tissue samples. H-score was calculated based on the percentage of positive cells and staining intensity using the following formula H-score = [1× (% cells 1+) + 2× (% cells 2+) + 3× (% cells 3+)]. The H-score ranges from 0-300. An average H-score of between 0-149 was considered “low expression” while an H-score of 150-300 was considered “high expression”. Results are expressed as mean ± SEM (bars).
