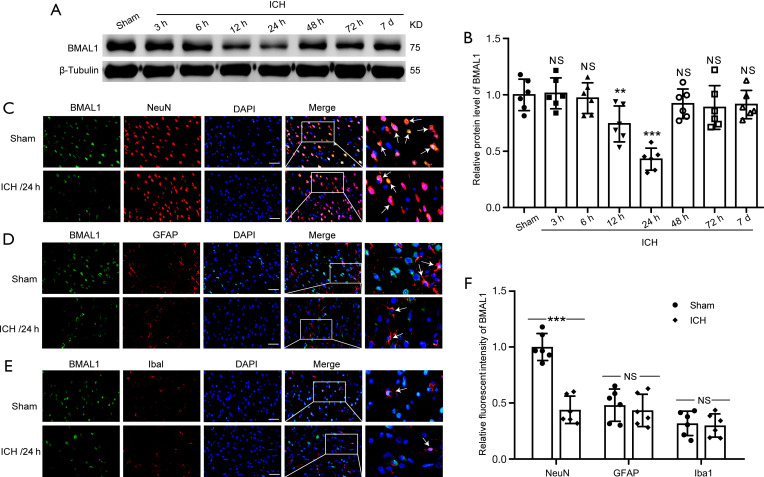
Figure 1.
Protein levels of BMAL1 in brain tissues after ICH in rats. (A) Western blot analysis of the relative BMAL1 expression levels in the rat brain tissues at various time points. (B) Quantification of the BMAL1 protein levels at various time points. (C) Double immunofluorescence staining was performed in brain sections using antibodies against BMAL1 (green) and a neuronal marker (red). Nuclei were fluorescently labeled with DAPI (blue). Arrow heads indicate BMAL1/NeuN-positive cells. (D) Double immunofluorescence staining was performed with antibodies against BMAL1 (green) and an astrocyte marker (GFAP, red) in brain sections. Nuclei were fluorescently labeled with DAPI (blue). Arrow heads indicate BMAL1/GFAP-positive cells. (E) Double immunofluorescence staining was performed with antibodies against BMAL1 (green) and a microglial marker (Iba1, red) in brain sections. Nuclei were fluorescently labeled with DAPI (blue). Arrow heads indicate BMAL1/Iba1-positive cells. Representative images from the sham and ICH (24 h) groups are shown. (F) Relative fluorescence intensity of BMAL1 with NeuN (neurons), GFAP (astrocytes) and Iba1 (microglia) in the brain at 24 h after ICH. Scale bar =50 µm. All data are presented as the means ± SEM, **P<0.01 vs. Sham group; ***P<0.001 vs. Sham group; NS, no significant difference vs. Sham group. n=6. ICH, Intracerebral hemorrhage; DAPI, 4’,6-diamidino-2-phenylindole; SEM, standard error of mean.

