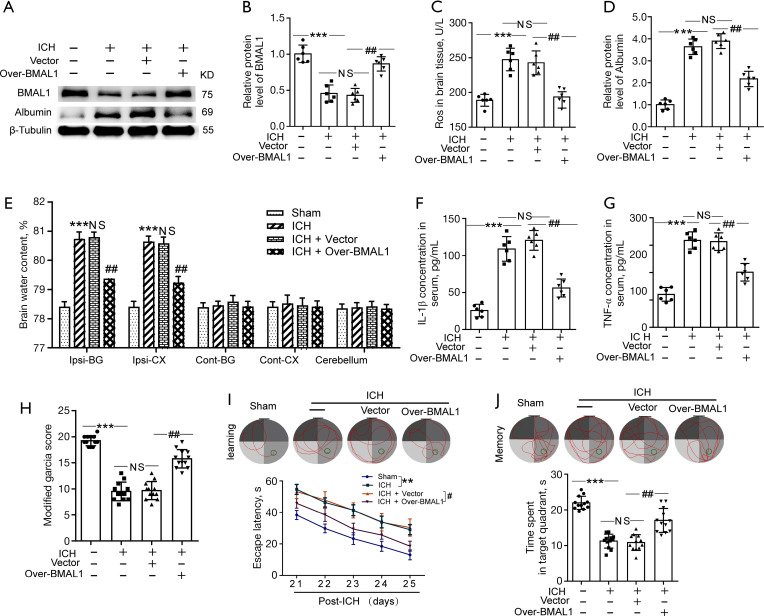
Figure 2.
Effects of BMAL1 overexpression on oxidative stress, BBB injury, brain edema, inflammation and neurobehaviors after ICH. (A) Western blot analysis of levels of the BMAL1 and Albumin proteins (index of BBB injury) in the sham, ICH, ICH + Vector and ICH + Over-BMAL1 groups at 24 h after ICH. (B) Quantification of the relative BMAL1 protein levels in the four groups. (C) ROS levels in the brain tissues from rats in the four groups. (D) Quantification of the relative Albumin protein levels in the four groups. (E) The effects of BMAL1 overexpression on the brain water content of rats in the four groups. (F) Concentrations of IL-1β in the serum of the sham ICH, ICH + Vector and ICH+Over-BMAL1 groups at 24 h after ICH. (G) Concentrations of TNF-α in the serum of the four groups listed above. (H) The scores on the modified Garcia test in the sham, ICH, ICH + Vector and ICH + Over-BMAL1 groups at 24 h after ICH. (I) Representative images illustrate swimming trajectories at 25 d (learning) and escape latency in the Morris water maze test at 21 to 25 d after ICH in the sham, ICH, ICH + Vector and ICH + Over BMAL1 rats. (J) Representative images illustrate swimming trajectories at 26 d (memory) and time spent in the platform quadrant in the Morris water maze test at 26 d after ICH in the groups listed above. **P<0.01 vs. Sham group; ***P<0.001 vs. Sham group; #P<0.05 vs. ICH + Vector group; ##P<0.01 vs. ICH + Vector group. NS, no significant difference vs. ICH group. In (A-G), n=6; In (H-J), n=10. BBB, blood brain barrier; ICH, intracerebral hemorrhage; ROS, reactive oxygen species.

