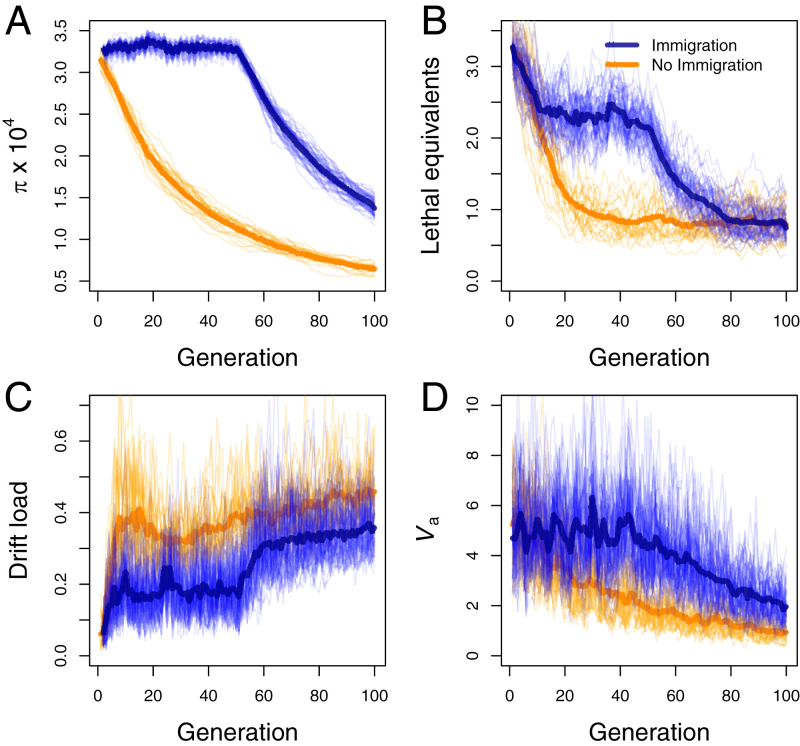
Fig. 2.
Genetic effects of bottlenecks with and without immigration. Nucleotide diversity () (A), number of lethal equivalents (B), drift load (C), and the additive genetic variance in a quantitative trait (Va) (D) are shown for 100 generations after a simulated bottleneck in isolated populations (orange) and with five immigrants every two generations up to generation 50 (blue). Population size was held constant at Ne = 1,000 for 1,000 generations before the bottleneck and then at Ne = 25 starting at generation 0. The thin lines show the results from 25 replicates. The thick lines represent the mean across 25 replicates. Immigrants during the first 50 generations are from a population with Ne = 500 that split from the receiving population the generation of the bottleneck. Details of the simulation model and parameters are provided in SI Appendix.

