Fig. 1.
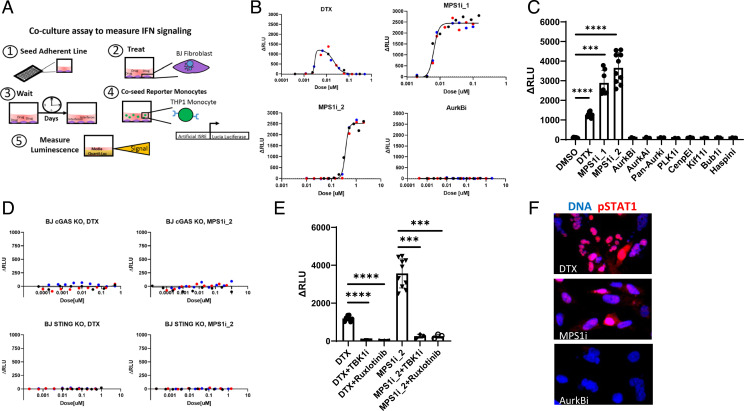
MT stabilizers and MPS1 inhibitors induce IFN secretion through the cGAS–STING axis. (A) Schematic of the luciferase coculture assay for measuring secreted IFN. The assay is as follows: 1) The adherent line is seeded in a 96-well plate, 2) BJ cells are exposed to drug, 3) BJ cells are cultured in drug for multiple days, 4) STING−/− reporter monocytes which express L. luciferase protein under an IFN response element are coseeded with the BJ cells for 18 h, and 5) luciferase is assayed with a plate reader. Luminescence signal reports on paracrine IFN signaling which originates in the BJ cells. (B) Dose–response for IFN signaling measured with the coculture luciferase assay. DTX produces a bell-shaped curve centered around 10 nM. MPS1 inhibitors (MPS1i_1 and MPS1i_2) produce a hyperbolic response. AurkB inhibition did not induce detectable IFN. ΔRLU is the measured signal with the background luminescence detected in vehicle controls subtracted. Different-color markers represent independent experiments. (C) IFN response induced in BJ cells by a panel of A-Ms. The doses for each drug are reported in Table 1. Only MT stabilizers and MPS1 inhibitors induce IFN signaling. Markers represent independent experiments. (D) BJ cells that lack either cGAS or STING do not produce IFN in response to MT stabilizers and MPS1 inhibitors. Different-color markers represent independent experiments. (E) TBK1 inhibition (MRT67307; 500 nM) and JAK 1/2 inhibition (ruxlotinib; 500 nM) suppress IFN induction by MT stabilizers and MPS1 inhibitors. Markers represent independent experiments. (F) BJ cells were treated with A-M for 3 d and stained for phospho-STAT1 (pSTAT1), a marker of IFN signaling. pSTAT1 showed increased expression and nuclear localization after treatment of BJ cells with DTX (20 nM) or MPS1i_1 (20 nM) but not after AurkB inhibition (100 nM). All error bars denote SD. ***P ≤ 0.001, ****P ≤ 0.0001.

