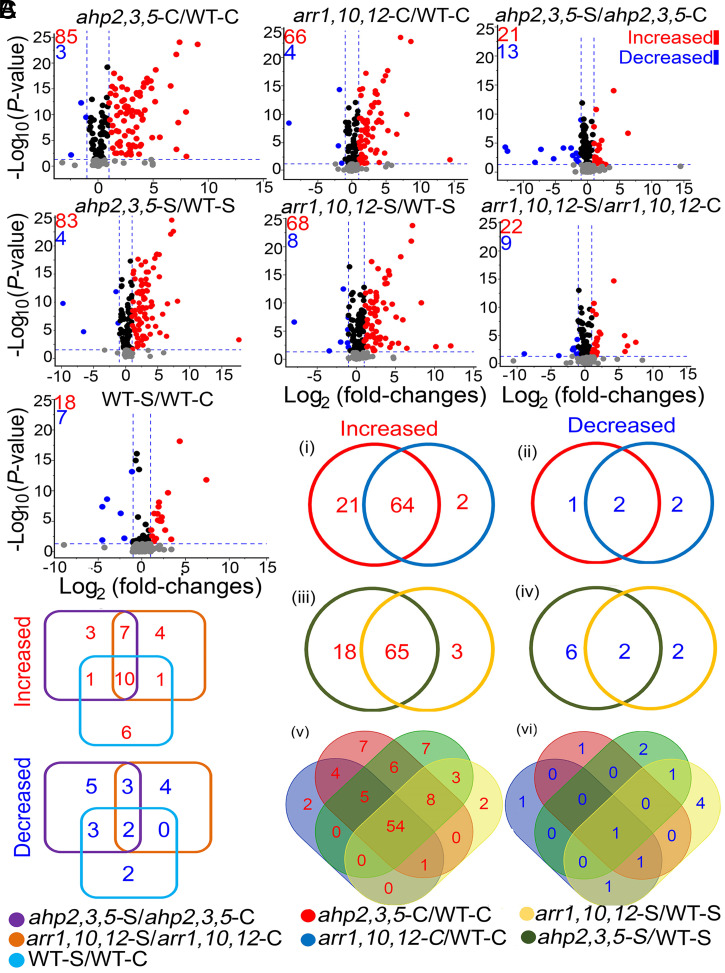
Fig. 2.
Volcano plots and Venn diagrams of DPMs in ahp2,3,5 and arr1,10,12 mutants, relative to WT plants, grown under nonsaline (ahp2,3,5-C/WT-C and arr1,10,12-C/WT-C) and saline (ahp2,3,5-S/WT-S and arr1,10,12-S/WT-S) conditions, as well as for each genotype, under saline versus nonsaline conditions (ahp2,3,5-S/ahp2,3,5-C, arr1,10,12-S/arr1,10,12-C, and WT-S/WT-C comparisons). (A) Volcano plots of significantly increased [log2 (fold-changes) ≥ 1; q-values ≤ 0.05], and decreased [log2 (fold-changes) ≤ −1; q-values ≤ 0.05] metabolites in the investigated comparisons. Blue-dashed lines represent the q-value and fold-change threshold. Red and blue points highlight the increased and decreased metabolites, respectively, in the investigated comparisons. (B) Venn diagrams of overlapping metabolites in the ahp2,3,5-C/WT-C and arr1,10,12-C/WT-C (i and ii); ahp2,3,5-S/WT-S and arr1,10,12-S/WT-S (iii and iv); and ahp2,3,5-C/WT-C, arr1,10,12-C/WT-C, ahp2,3,5-S/WT-S, and arr1,10,12-S/WT-S comparisons (v and vi). (C) Venn diagrams of overlapping metabolites in the ahp2,3,5-S/ahp2,3,5-C, arr1,10,12-S/arr1,10,12-C, and WT-S/WT-C comparisons. Three independent biological replicates (n = 3) from WT and CK-signaling mutant genotypes were collected for the metabolome (primary and secondary metabolites, except lipids) analysis, while five biological replicates (n = 5) were collected for lipidome analysis.

