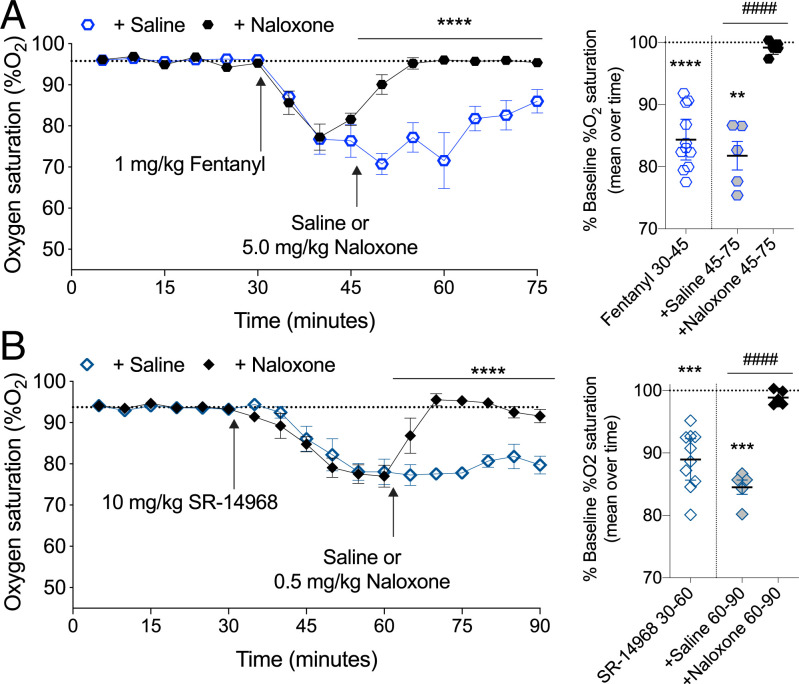
Fig. 5.
Naloxone reversal of fentanyl- and SR-14968-induced respiratory suppression. (A) Following a 30-min habituation to determine the baseline, the mice were treated with 1 mg/kg, i.p. fentanyl; after 15 min, naloxone (5 mg/kg, i.p.) was administered; the dotted line indicates the mean baseline response over the first 30 min. Comparing the fentanyl + naloxone and fentanyl + saline effect by two-way RM-ANVOA: F(1-9)=49.86, ****P < 0.0001, n = 5 saline, 6 naloxone. The mean of %O2 for each time bin is presented to the right comparing drug response to baseline (**P < 0.01, ****P < 0.0001, one-way RM-ANOVA) and comparing saline to naloxone (####P < 0.0001, unpaired Student’s t test). (B) SR-14968 (10 mg/kg, i.p.) was administered and, after 30 min, the mice were given naloxone (0.5 mg/kg, i.p.); the dotted line indicates the mean baseline response over the first 30 min. Comparing the SR-14968 + naloxone and SR-14968 + saline effect by two-way RM-ANOVA: F(1-8)=101.6, ****P < 0.0001, n = 5 per group. The mean of %O2 for each time bin comparing drug response to the baseline (***P < 0.001, one-way RM-ANOVA) and comparing the saline to naloxone effect (####P < 0.0001, unpaired Student’s t test).

