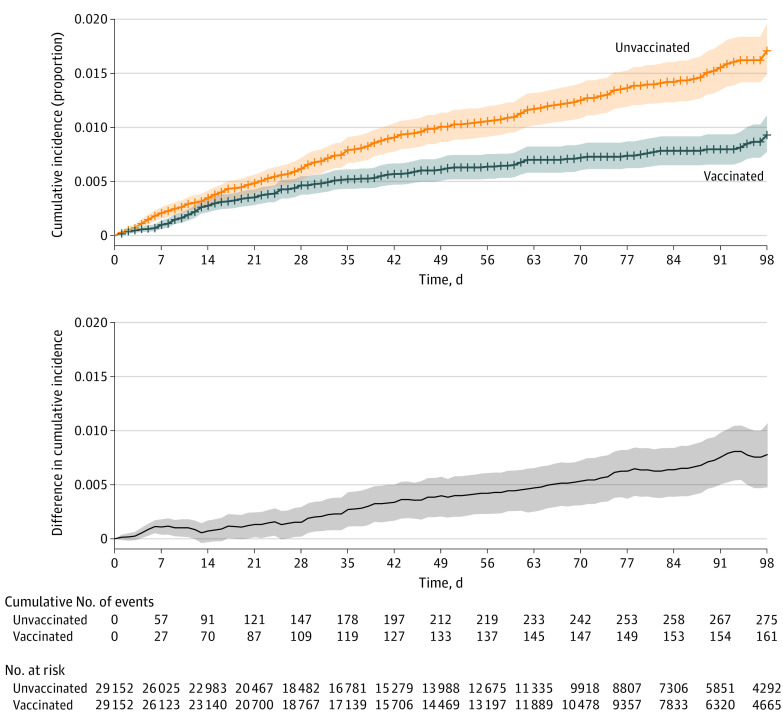
Figure 1. Cumulative Incidence of SARS-CoV-2 Infection After First Vaccine Dose in the Overall Matched Cohort.
Cumulative incidence curves of SARS-CoV-2 infection in the overall matched cohort using time zero as the date of the first dose of vaccination. The difference in cumulative incidence is illustrated in the gray bottom graph. Shaded areas indicate 95% CIs calculated by bootstrapping.

