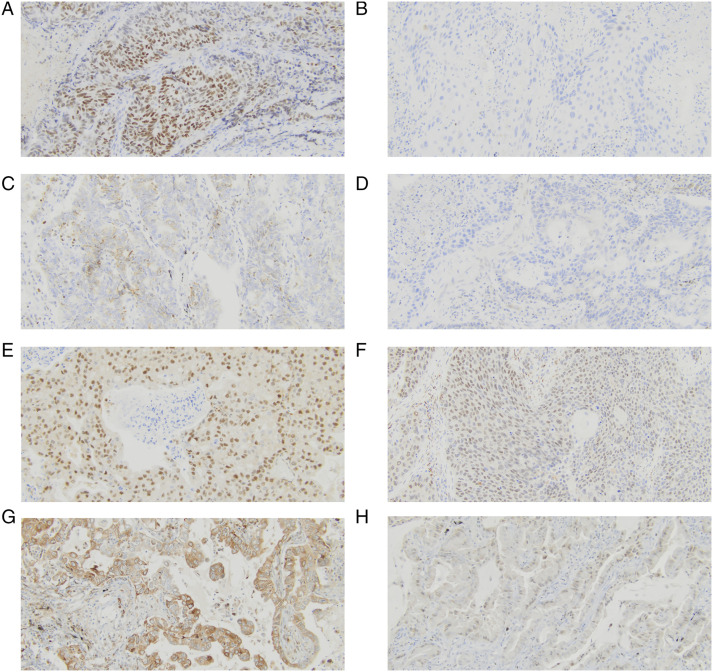
Figure 1.
Immunohistochemical analysis of SATB1n, SATB1c, SMAD3, and TLR2 expression in NSCLC tissues (primary magnification ×20). (A) Strong positive (+3) nuclear staining for SATB1, (B) Negative expression of nuclear staining for SATB1, (C) Positive cytoplasmic staining for SATB1, (D) Negative expression of cytoplasmic SATB1, (E) Strong positive (+3) staining for SMAD3, (F) Negative expression of SMAD3, (G) Strong positive (+3) staining for TLR2, (H) Negative expression of TLR2.

