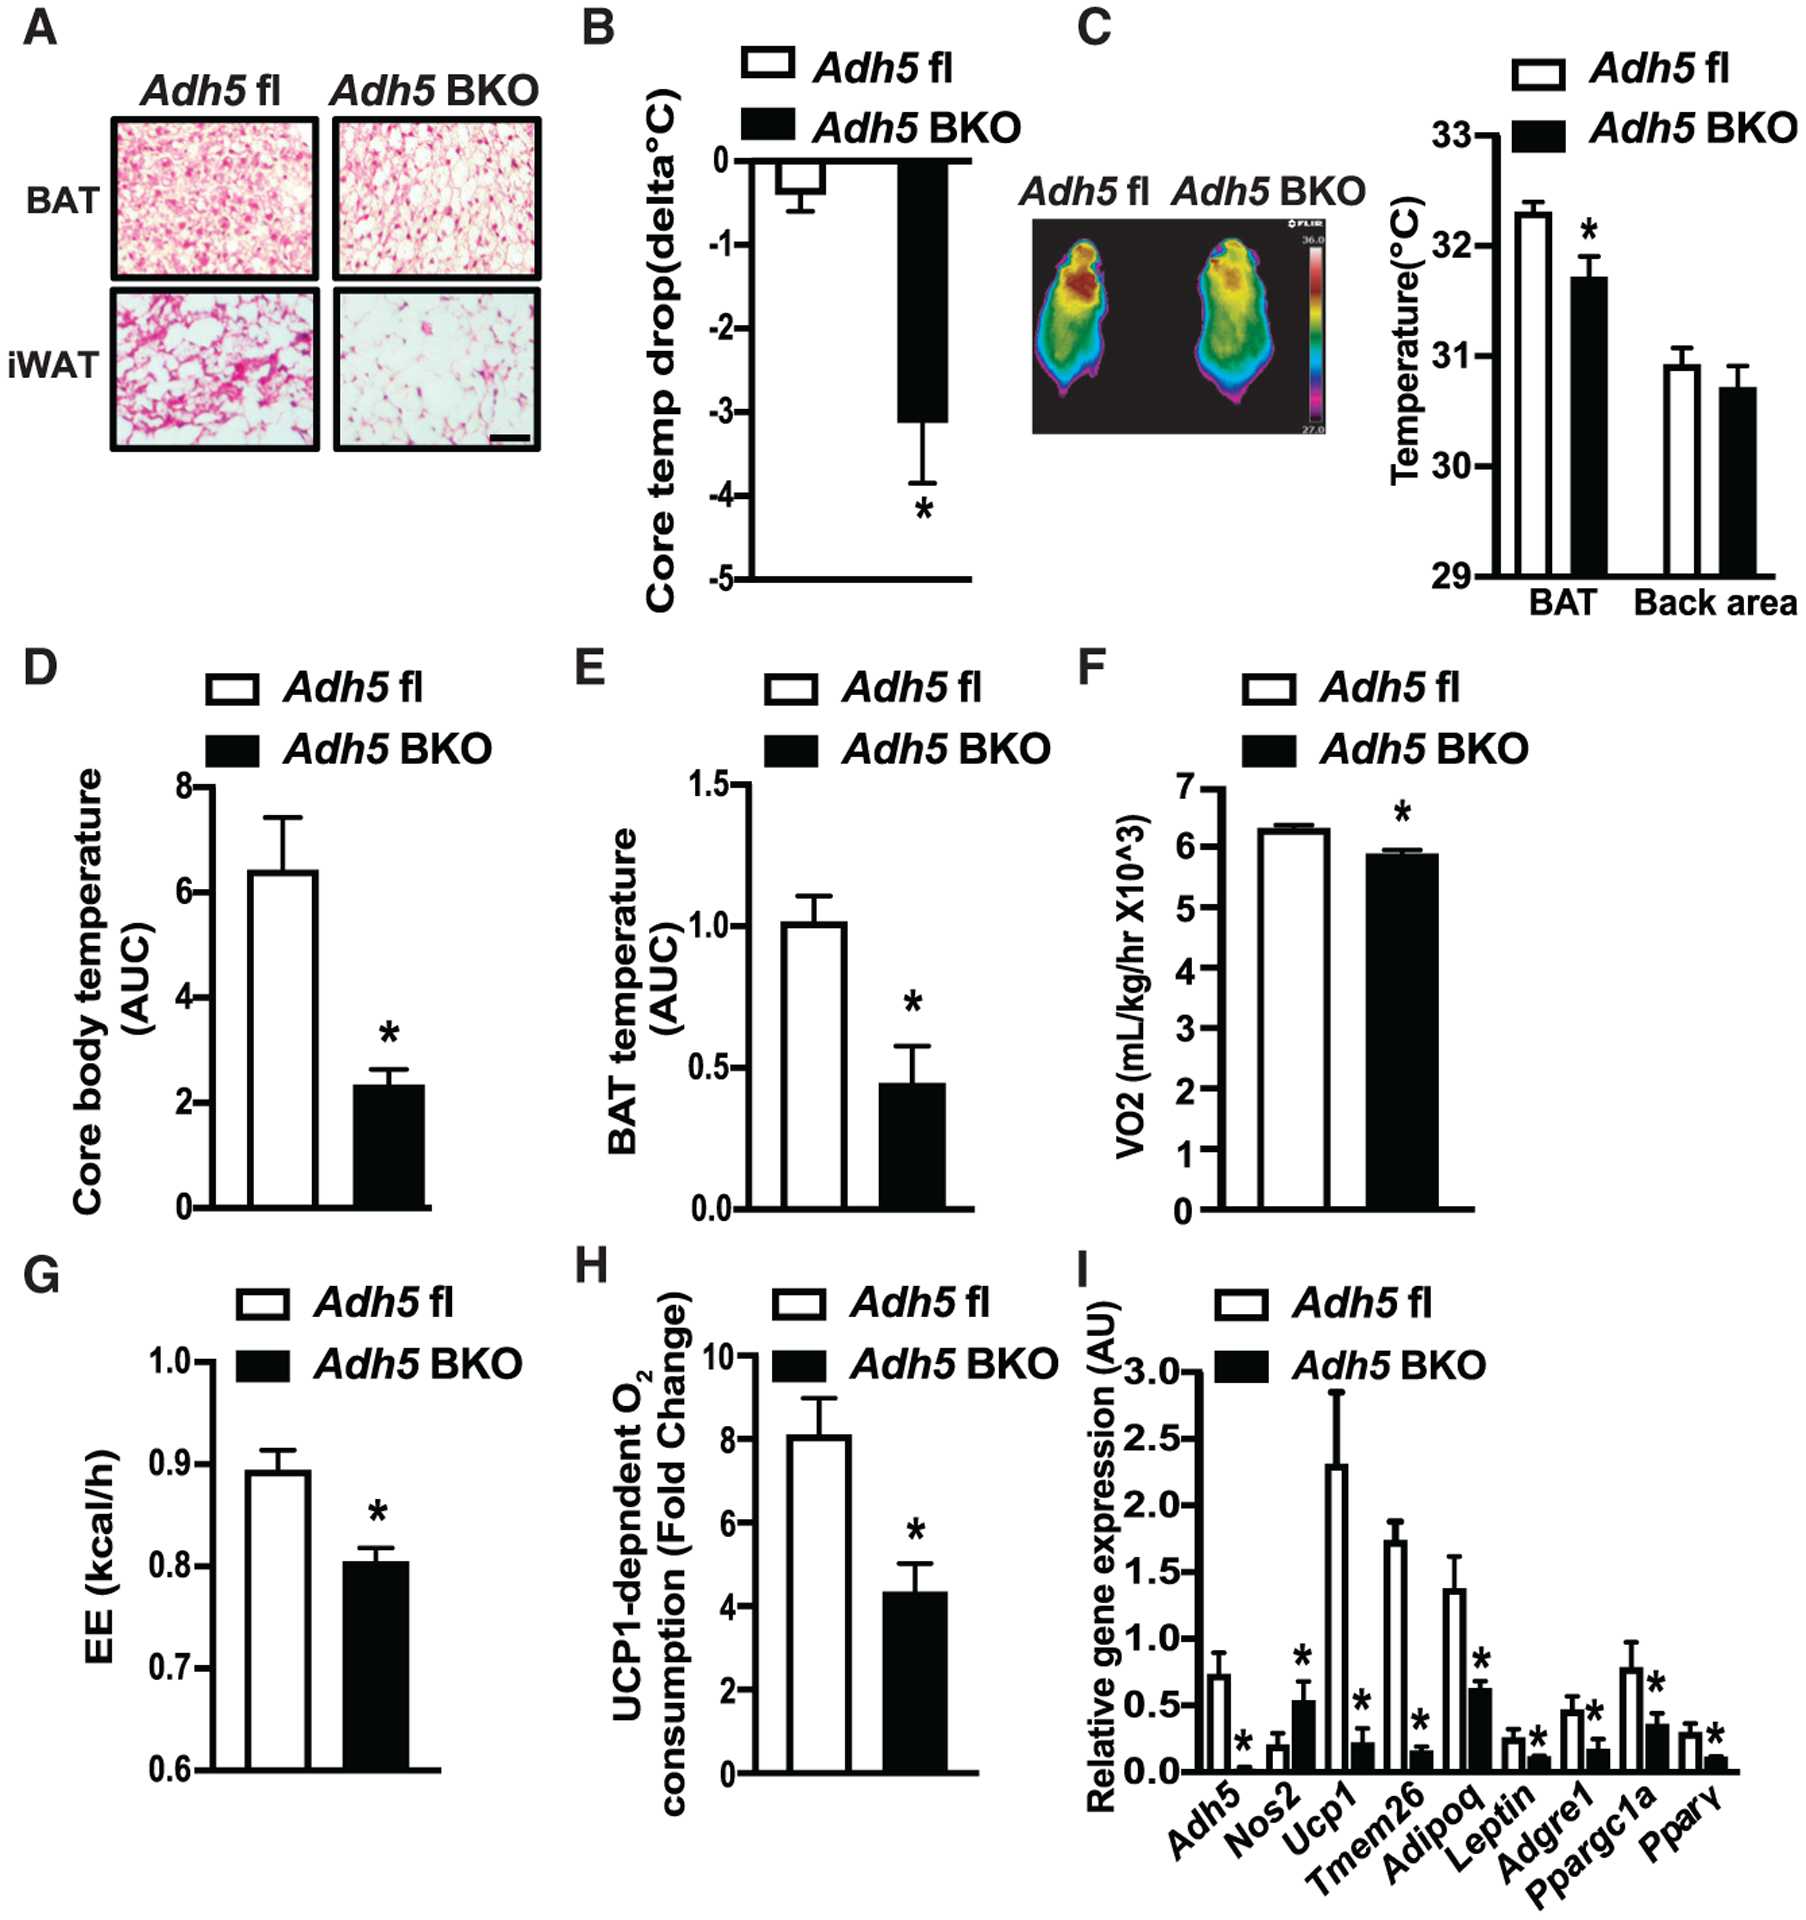
Figure 4. ADH5 is required for cold-induced BAT thermogenesis.

(A and B) Representative H&E images from BAT or iWAT (A) and cold tolerance from Adh5fl and Adh5BKO mice housed at 30°C following cold exposure to 4°C for 24 h (B). Data are presented as difference in core body temperature between 30°C and 4°C. n = 3–5 mice group. Scale bar, 100 μm.
(C) Representative high-resolution infrared images of body surface temperature of Adh5fl and Adh5BKO mice. Quantification of the images is shown by the side of image. n = 5 mice/group.
(D–G) Core temperature (AUC, area under the curve of dark cycles) (D), BAT temperature (AUC of dark cycles) (E), whole-body VO2 (F), and whole-body energy expenditure (EE) (G) measured in Adh5fl and Adh5BKO mice housed within a CLAMS at 4°C (n = 4–5 mice/group).
(H) UCP1-dependent O2 consumption in BAT from mice in (B). n = 4 mice/group.
(I) qPCR analysis measuring levels of mRNAs encoding the indicated genes in BAT from mice in (B). Expression was normalized to Gapdh.
All data are presented as means ± SEM. Asterisk indicates statistical significance compared to the Adh5fl group as determined by Student’s t test; p <0.05.
