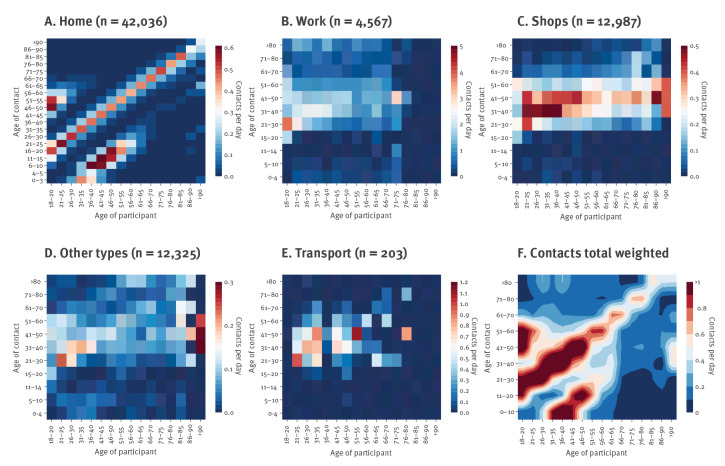
Figure 2.
Contact matrices during national lockdown, France, April 2020
Frequency of individual close contacts at less than 1 m per day according to age of participant (x-axis) and age of the contact (y-axis).
All contacts weighted using the French population distribution [8] and professional activity distributions during lockdown (COVID-19 Barometer).

