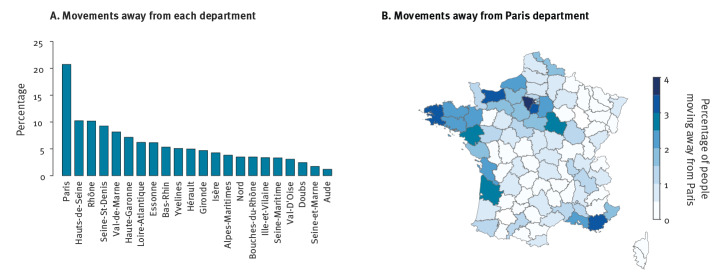
Figure 3.
Spatial dispersion during national lockdown, France, April 2020
A. Percentage of the respondents for whom department of stay during lockdown differs from their home department. Only departments with more than 500 responses are represented in the figure.
B. Maps of department residencies during lockdown for individuals declaring department 75 (Paris) as their home department.

