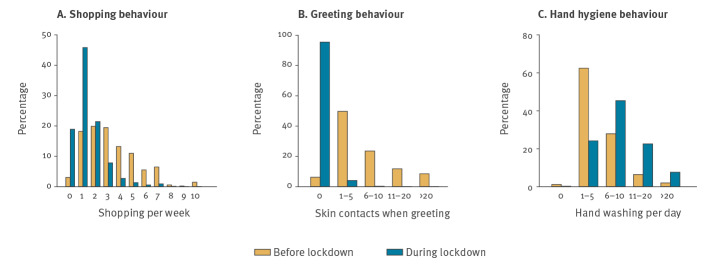
Figure 4.
Lockdown-associated behaviours, France, April 2020
A. Change in shopping frequency. Distributions of shopping frequency (number of times individuals shop in a week) before (yellow) and during (blue) lockdown.
B. Frequency of hand washing before and during lockdown. Distributions of number of reported contact-associated to greeting behaviour in a typical day before (yellow) and during (blue) lockdown.
C. Change in greeting behaviour. Distributions of reported frequencies of hand washing in a typical day before (yellow) and during (blue) lockdown.
The percentages are weighted to account for the French population distribution (age and sex) reported by the French National Institute of Statistics and Economic Studies in 2019 [9].

