FIGURE 3.

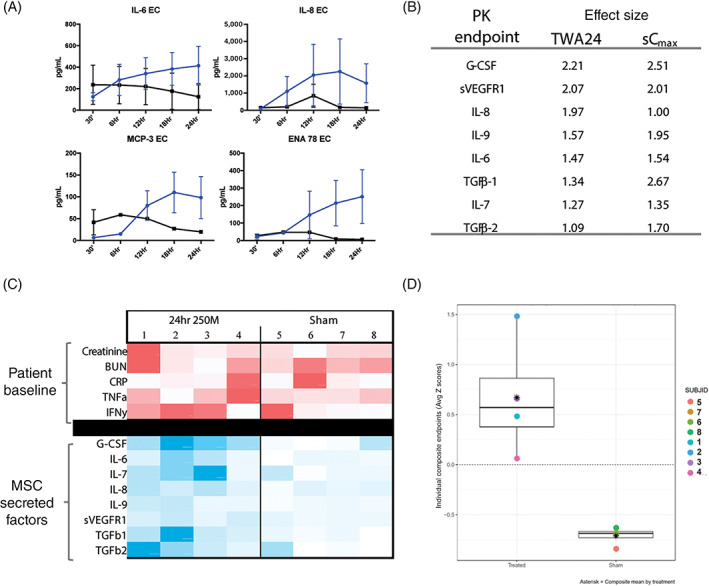
Pharmacokinetic analysis of SBI‐101 treatment shows sustained and subject‐specific exposure to mesenchymal stem cell (MSC)–secreted factors (n = 4 per group). A, Multiplex immunoassay measurements of MSC‐secreted factors in SBI‐101 (blue) compared with sham (black). B, PK biomarkers with effect sizes greater than one (absolute value). C, Participant‐specific analysis of MSC‐secreted factors as a function of patient baseline phenotype. A heatmap was created using measurements of baseline inflammatory and kidney function markers (red) and TWA24 for the secreted factors during therapy (blue). Comparative analysis of intensities was calculated within each row with darker colors representing larger values. D, Standardized TWA24 Z‐scores in treated and sham subjects for PK composite: G‐CSF, IL‐6, IL‐7, IL‐8, IL‐9, sVEGFR1. Differences between sham and treated subjects can be easily detected as the full range of Z‐scores observed among treated patients was positive. 250M, 250 × 106 MSCs; BUN, blood urea nitrogen; CRP, C‐reactive protein; EC, extracapillary; ENA 78, epithelial‐derived neutrophil‐interacting protein 78; G‐CSF, granulocyte colony‐stimulating factor; IFNγ, interferon γ; IL, interleukin; MCP‐3, monocyte chemoattractant protein 3; PK, pharmacokinetic; sCmax, maximum concentration; sVEGFR1, soluble vascular endothelial growth factor receptor 1; TGF, transforming growth factor; TNFα, tumor necrosis factor α; TWA24, time‐weighted average over 24‐hour treatment period
