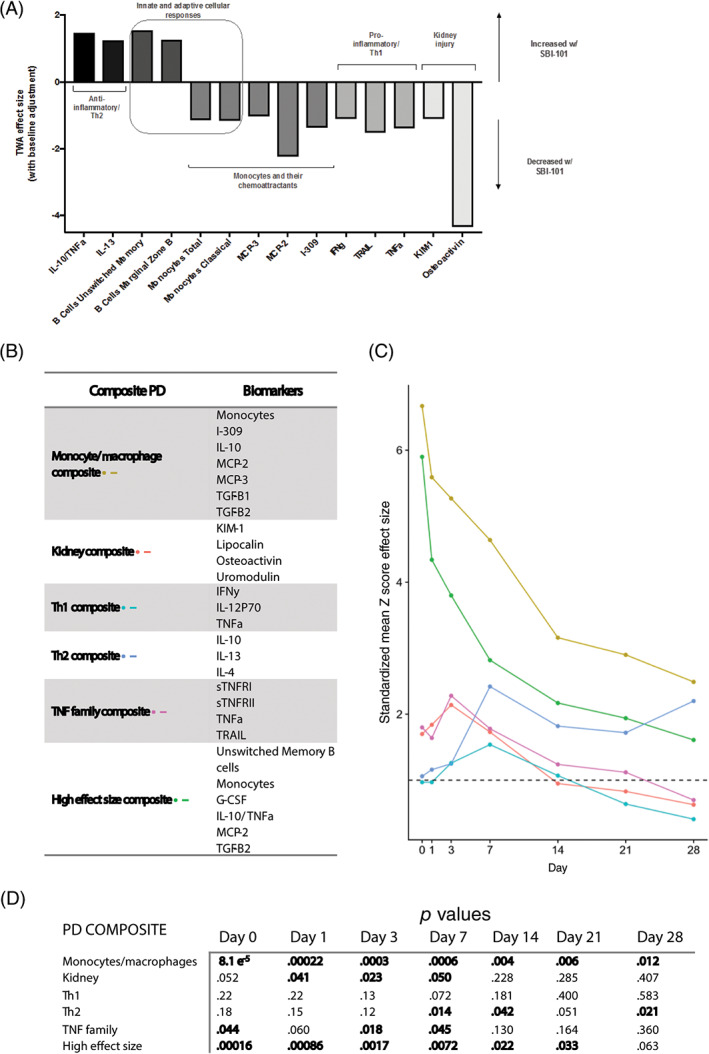
FIGURE 6.

Effect sizes of individual and composite pharmacodynamic markers. A, SBI‐101 induced changes in both molecular and cellular parameters with effect sizes greater than one. B, Composite groupings were created based on both the magnitude of effect size and the scientific plausibility of each combination. C, Composite scores were generated for each subject. Composite Z‐scores were the average Z‐score across markers within a composite group, for each subject and time point. Composite endpoints were generated for each treatment group by averaging the individual composite Z‐scores in each group. Finally, composite endpoints were used to generate composite effect sizes, calculated as the difference between treated and control composite endpoints divided by the pooled SD. D, Values of P from a two‐tailed t test performed for each group at each observation day after treatment. G‐CSF, granulocyte colony‐stimulating factor; I‐309, inflammatory cytokine I‐309; IFNγ, interferon γ; IL, interleukin; KIM‐1, kidney injury molecule 1; MCP, monocyte chemoattractant protein; PD, pharmacodynamic; sTNFR, soluble TNF receptor; TGF, transforming growth factor; Th1, T helper cell type 1; Th2, T helper cell type 2; TNF, tumor necrosis factor; TRAIL, TNF‐related apoptosis‐inducing ligand; TWA, time‐weighted average
