FIGURE 3.

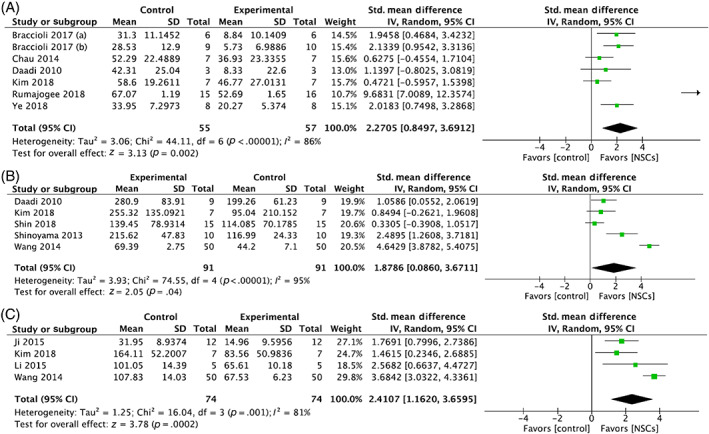
Forest plot demonstrating the effect of neural stem cells compared with controls on (A) impaired forelimb use, (B) rotarod test performance, and (C) Morris water maze test performance

Forest plot demonstrating the effect of neural stem cells compared with controls on (A) impaired forelimb use, (B) rotarod test performance, and (C) Morris water maze test performance