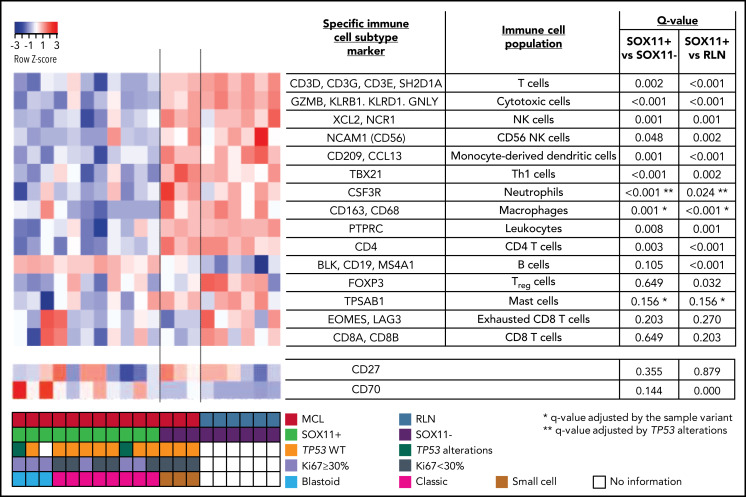
Figure 1.
NanoString-based immune cell content in nodal MCLs. (A) Heatmap showing scaled (z score) raw abundance of different immune cell populations, and CD27 and CD70 mRNA expression, using the nCounter Analysis System, comparing the NanoString immune GEP of 11 SOX11-positive (SOX11+) and 3 negative (SOX11−) nodal MCLs, and 6 nontumoral reactive lymph nodes (RLN) samples. Red indicates high abundance; blue indicates low abundance. Genes used as specific immune cell subtype markers to determine different immune cell populations and the adjusted P values are indicated in the right part of the heatmap. P value correction was performed independently for immune cell populations and for individual genes. The comparisons in the macrophages, mast cells, and neutrophils immune cell populations were adjusted by potential confounding factors (*blastoid/pleomorphic cytological variant for the first 2 and **TP53 alterations for the latter) (supplemental Figure 1D-F). Molecular features of MCL cases are shown at the bottom.

