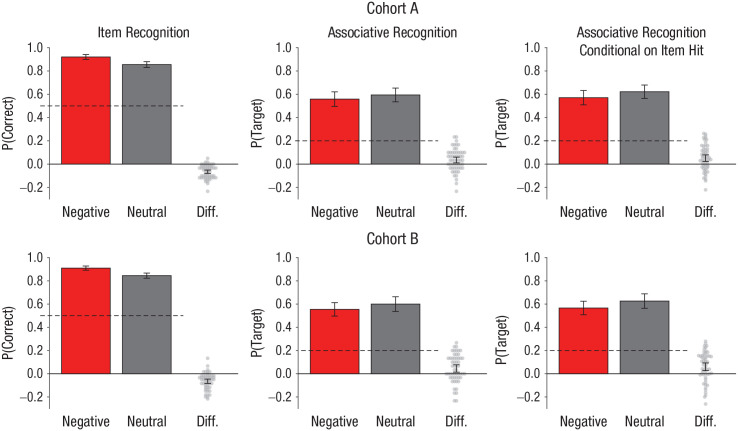
Fig. 2.
Performance of cohort A (top row) and cohort B (bottom row). The proportion of negative and neutral images correctly identified as old or new in the item-recognition task (“what”) is shown on the left. The proportion of negative and neutral target images correctly selected in the associative-recognition task (“which”) is shown in the middle. Associative recognition of negative and neutral images in the “which” task conditioned on item hit in the “what” task is shown on the right. In each graph, difference scores (Diff.) for each participant were calculated by subtracting accuracy for negative images from accuracy for neutral images. The dashed lines denote chance performance (50% and 20% correct for the item- and associative-recognition tasks, respectively). The error bars represent 95% confidence intervals.

